Why the Battery System for Electric Ferries Matters to Every EV Buyer
When a 280-passenger electric ferry crosses Puget Sound or docks in Oslo, it relies on a battery system that shares the same fundamental chemistry as the one sitting in your driveway. The marine industry's shift toward electrification has pushed battery engineering to extremes — massive kWh capacities, aggressive cycle-life demands, and thermal management systems that must perform in saltwater environments. Understanding how engineers solve these problems at scale offers a masterclass in what makes any EV battery tick, whether it powers a 6,000-pound SUV or a 400-ton vessel.
This guide breaks down the core battery technologies used in electric vehicles and electric ferries alike: chemistry trade-offs, real-world degradation curves, warranty structures, replacement economics, and the monitoring tools available to owners today. The numbers here are drawn from 2025–2026 model-year passenger EVs and publicly available marine electrification data.
Battery Chemistry: LFP vs NMC/NCA Trade-Offs
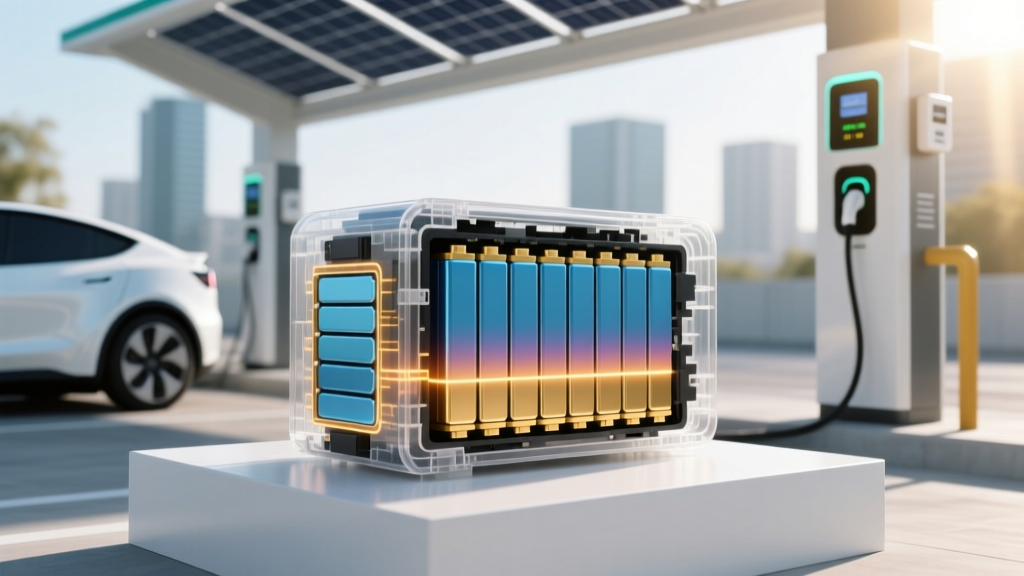
Every lithium-ion battery pack — from a Tesla Model 3 to the battery system for an electric ferry operated by Norway's Norled — relies on one of two dominant cathode chemistries: lithium iron phosphate (LFP) or nickel manganese cobalt / nickel cobalt aluminum (NMC/NCA). The choice dictates energy density, lifespan, cost, and cold-weather behavior.
| Attribute | LFP (Lithium Iron Phosphate) | NMC / NCA (Nickel-based) |
|---|---|---|
| Energy Density (cell-level) | 160–180 Wh/kg | 220–300 Wh/kg |
| Typical Cycle Life (to 80% SoH) | 3,000–6,000+ cycles | 1,000–2,500 cycles |
| Cold Performance (−10°C) | ~15–25% range loss | ~10–20% range loss |
| Cost per kWh (2025–2026) | $80–$110 | $110–$145 |
| Thermal Stability | Excellent (higher runaway threshold) | Good (requires robust BMS) |
| Common Automotive Use | Tesla Model 3 RWD, Ford Mustang Mach-E Select, BYD models | Hyundai Ioniq 5, Kia EV6, long-range AWD trims |
| Marine / Ferry Use | Preferred for short-route, high-cycle ferries | Used where space/weight constraints dominate |
For passenger EVs, the practical takeaway is straightforward: LFP packs sacrifice some range-per-pound but gain dramatically in longevity and cost. A 2026 Tesla Model 3 RWD with its ~60 kWh LFP pack carries an EPA range of 272 miles, while the Long Range AWD variant with an NMC-based ~82 kWh pack achieves 363 miles. The LFP car is heavier per kWh stored, but its cycle life means you can charge it to 100% daily without the degradation anxiety that NMC owners manage.
In the marine sector, the battery system for electric ferries increasingly favors LFP. Ferries on fixed routes (think 20–40 nautical miles round-trip) don't need maximum energy density — they need a pack that survives 10,000+ charge cycles over a 15-year vessel life. Companies like Corvus Energy and Echandia supply LFP-based marine battery systems rated for exactly this duty cycle. When weight and volume are at a premium — such as a high-speed passenger catamaran — NMC remains the choice.
How Long Do EV Batteries Last? Real Degradation Data
Battery degradation is measured as a percentage loss of original capacity, expressed through State of Health (SoH). A new battery starts at 100% SoH; most manufacturers warranty the pack down to 70% SoH over 8 years or 100,000 miles.
Real-world data compiled from fleet studies and owner telemetry tells a more nuanced story than the warranty floor suggests:
| Vehicle / Platform | Chemistry | SoH at 50k Miles | SoH at 100k Miles | SoH at 150k+ Miles | Source |
|---|---|---|---|---|---|
| Tesla Model 3/Y (NMC, 2019–2023) | NMC | ~93–95% | ~88–91% | ~84–88% | Tesla Impact Report 2024 |
| Tesla Model 3 RWD (LFP, 2022–2025) | LFP | ~96–98% | ~92–95% | ~89–93% (projected) | Owner fleet telemetry |
| Nissan Leaf (2013–2017, air-cooled) | NMC | ~88–92% | ~78–85% | ~70–78% | fueleconomy.gov / owner surveys |
| Hyundai Ioniq 5 (2022–2025) | NMC | ~94–96% | ~89–92% | Pending (too new) | Manufacturer / fleet data |
| Electric ferry (LFP marine, Corvus) | LFP | ~97%+ (2 yrs) | N/A (cycle-based) | ~85–90% at 30k cycles | Corvus Energy published data |
The critical insight: most modern EV batteries with active liquid cooling outlast the vehicles they're installed in. The early-generation Nissan Leaf — with its passive air-cooled pack — was the outlier that fueled replacement-cost fears. Current liquid-cooled packs from Hyundai, Tesla, GM, and Ford show degradation curves that flatten significantly after the initial 5–10% loss in the first year.
For marine applications, degradation is tracked by cycle count rather than mileage. A typical electric ferry battery system might see 3–5 partial cycles per day (charge to 90%, discharge to 20%, recharge at dock). At that rate, an LFP pack rated for 6,000 cycles to 80% SoH provides roughly 8–10 years of service before capacity drops below warranty thresholds — aligning with planned mid-life vessel refits.
What Does the Battery Warranty Actually Cover?
Federal law in the United States mandates that EV battery warranties cover a minimum of 8 years or 100,000 miles (whichever comes first) for emissions-related components, and California Air Resources Board (CARB) states extend this to 10 years / 150,000 miles. Most manufacturers structure their high-voltage battery warranties around a capacity retention threshold.
| Manufacturer | Warranty Period | Mileage Limit | Capacity Threshold | Notes |
|---|---|---|---|---|
| Tesla (Model 3/Y LFP) | 8 years | 120,000 mi | 70% SoH | Includes drive unit |
| Tesla (Model 3/Y LR NMC) | 8 years | 120,000 mi | 70% SoH | Same threshold |
| Hyundai / Kia | 10 years | 100,000 mi | 70% SoH | Among industry's longest |
| Ford (Mustang Mach-E) | 8 years | 100,000 mi | 70% SoH | Battery + electric components |
| GM (Ultium platform) | 8 years | 100,000 mi | 70% SoH (60% for Bolt) | Varies by model |
| Rivian | 8 years | 175,000 mi | 70% SoH | Higher mileage cap for trucks |
Warranties cover defects and abnormal degradation — meaning if your pack drops below the stated threshold within the warranty period, the manufacturer replaces or refurbishes it at no cost. They do not cover damage from accidents, flooding, or unauthorized modifications. Importantly, the warranty applies to the high-voltage traction battery only — the 12V auxiliary battery that powers lights and electronics follows a standard 3-year / 36,000-mile bumper-to-bumper schedule.
In the marine sector, battery system warranties for electric ferries are negotiated B2B and typically span 5–10 years with guaranteed SoH curves written into the vessel purchase contract. Suppliers like Corvus Energy and Wärtsilä offer performance guarantees tied to specific cycle counts and operating conditions.
EV Battery Replacement Costs: What You'll Actually Pay
Battery replacement is the single biggest fear among prospective EV buyers — and the single most misunderstood cost. Here's the reality: fewer than 2% of EVs in the current US fleet have required a full pack replacement outside of warranty, according to data from Consumer Reports. When replacements do occur, they're overwhelmingly covered by the manufacturer.
For out-of-warranty scenarios, here's what the market looks like in 2026:
| Vehicle | Pack Size | Chemistry | OEM Replacement Cost | Refurbished / Third-Party | Typical Need Timeline |
|---|---|---|---|---|---|
| Tesla Model 3 RWD | ~60 kWh | LFP | $12,000–$15,000 | $8,000–$11,000 | 200,000+ mi / 15+ yrs |
| Tesla Model Y LR | ~82 kWh | NMC | $14,000–$18,000 | $10,000–$14,000 | 180,000+ mi / 12+ yrs |
| Hyundai Ioniq 5 | ~77.4 kWh | NMC | $15,000–$20,000 | $10,000–$14,000 | 180,000+ mi / 12+ yrs |
| Ford F-150 Lightning Ext. | ~131 kWh | NMC | $22,000–$30,000 | $16,000–$22,000 | 150,000+ mi / 12+ yrs |
| Chevy Bolt EV/EUV | ~65 kWh | NMC | $14,000–$16,000 | $9,000–$12,000 | Recall-replaced packs; 150k+ mi |
For context, the average US driver keeps a vehicle for roughly 8.5 years and drives about 14,000 miles per year — totaling ~119,000 miles before trade-in. The vast majority of EVs will be sold, traded, or scrapped before the battery needs replacement. And cell-level pricing continues to decline: BloombergNEF reports lithium-ion pack prices fell below $115/kWh in 2025, with LFP cells dipping below $70/kWh at scale.
Marine battery replacements for electric ferries follow a different economic model. A 2–4 MWh ferry battery system may cost $300,000–$800,000 to replace, but these costs are amortized over the vessel's 25–30 year operational life and built into the operator's capital expenditure planning. Modular marine battery designs (where individual racks can be swapped) further reduce the cost of partial replacements.
Factors That Accelerate or Preserve Battery Life
Battery degradation isn't random — it's driven by identifiable, controllable factors. Here's what the data shows:
Fast-Charging Frequency
Exclusive DC fast charging (150–350 kW) accelerates degradation compared to Level 2 home charging. A National Renewable Energy Laboratory (NREL) study found that vehicles fast-charged more than 3 times per week showed approximately 2–3% additional capacity loss over 100,000 miles versus those primarily charged at Level 2. The effect is real but modest — not catastrophic. For daily driving, Level 2 charging at 7–11 kW remains the longevity-friendly choice.
State of Charge Habits
For NMC/NCA chemistries, consistently charging to 100% or discharging below 10% accelerates calendar aging. The recommended daily window is 20–80% SoC. LFP chemistry is more tolerant of high SoC — Tesla and BYD both recommend periodic 100% charges for LFP packs to maintain cell-balancing accuracy. This is one area where LFP genuinely simplifies ownership.
Temperature Extremes
Sustained exposure to ambient temperatures above 95°F (35°C) accelerates electrolyte decomposition. Vehicles in Arizona, Texas, and the Middle East show slightly faster degradation curves than those in temperate climates. Conversely, cold temperatures don't permanently damage batteries but do temporarily reduce capacity and slow charge acceptance. Active thermal management (liquid cooling/heating) — standard on virtually all 2025–2026 EVs — mitigates both extremes.
Marine-Specific Factors
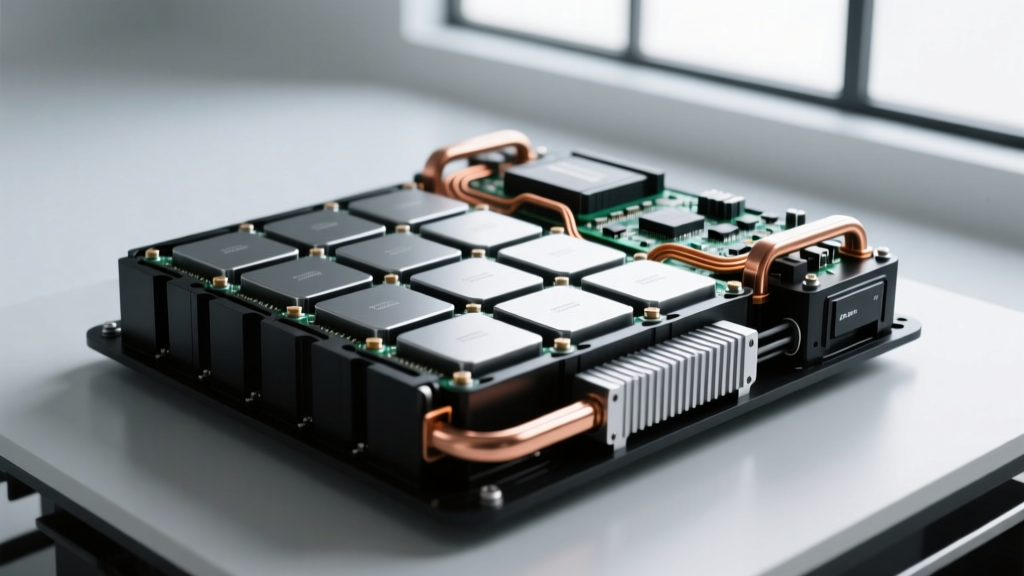
Battery systems for electric ferries face additional stressors: vibration, salt-air corrosion, and high-cycle shallow-discharge patterns. Marine-grade packs address these with IP67-rated enclosures, conformal-coated bus bars, and battery management systems (BMS) tuned for partial-state-of-charge operation. The engineering lessons — robust thermal management, conservative SoC windows, modular architectures — translate directly to automotive durability.
Battery Care Checklist for Maximum Longevity
- Daily charging: Set charge limit to 80% for NMC/NCA; 100% is fine for LFP
- Fast charging: Use DC fast charging for road trips, not daily commutes
- Storage: If parking for 2+ weeks, leave SoC at 50–60%
- Preconditioning: Use scheduled departure to warm the battery before cold-morning driving
- Avoid: Repeatedly draining below 10% or sitting at 100% SoC in extreme heat
- Monitor: Check SoH via the vehicle app or OBD2 scanner at least annually
How to Check and Monitor Battery Health (SoH)
State of Health (SoH) tells you how much of the battery's original capacity remains. Most modern EVs surface this data through the manufacturer's connected app or in-vehicle diagnostics, but the depth of information varies:
- Tesla: The mobile app shows estimated range at 100% charge. By comparing this to the original EPA range, you can approximate SoH. Third-party tools like Tessie or Stats for Tesla provide more granular degradation graphs.
- Hyundai / Kia: The infotainment system's EV diagnostics page displays a battery health percentage directly. The Hyundai/Kia app also surfaces estimated range at full charge.
- Ford: The FordPass app provides battery health status and remaining warranty coverage.
- OBD2 scanners: Devices like the OBDLink MX+ paired with apps such as ABRP (A Better Route Planner) or Car Scanner can read detailed BMS data including individual cell voltages, pack temperature, and calculated SoH — on most brands.
For electric ferry operators, battery health monitoring is continuous and industrial-grade. Marine battery management systems stream real-time data — cell voltage, temperature, current, SoH estimates — to shore-based operations centers. Companies like Echandia and Corvus Energy provide cloud dashboards where fleet managers track degradation curves across every vessel in operation, flagging anomalies before they become failures.
Emerging Battery Technology: What's Next (and When)
Several next-generation battery technologies are in development, each with implications for both automotive and marine applications:
Solid-State Batteries
Solid-state cells replace the liquid electrolyte with a solid ceramic, polymer, or sulfide separator — promising higher energy density (potentially 400–500 Wh/kg at the cell level), faster charging, and improved safety. Toyota, Samsung SDI, and QuantumScape have all announced pilot production lines. However, as of early 2026, no solid-state battery is in mass production for consumer vehicles. Toyota's announced timeline targets limited production in 2027–2028, with meaningful volume unlikely before 2030. Cost remains the primary barrier: solid-state cells currently cost 3–5x more than equivalent NMC cells.
Silicon Anode Technology
Replacing graphite anodes with silicon can boost energy density by 20–40%. Companies like Sila Nanotechnologies and Group14 are supplying silicon-dominant anode materials to battery manufacturers. Mercedes-Benz's upcoming G-Class EV (announced for 2025–2026) was among the first vehicles to feature silicon-anode cells from Sila. This technology is closer to mainstream adoption than solid-state and is already appearing in limited production.
Sodium-Ion Batteries
CATL and BYD have begun producing sodium-ion cells for lower-cost, lower-range applications. Energy density is roughly 120–160 Wh/kg — less than LFP — but raw material costs are dramatically lower since sodium is abundant. Initial applications target budget city cars and energy storage. For electric ferries on short, fixed routes, sodium-ion could eventually offer a cost-optimized alternative to LFP, though marine certification timelines will delay adoption.
None of these technologies are available to buy today in a mainstream EV or ferry. Treat any manufacturer claim of "solid-state production" before 2028 with skepticism. The current LFP and NMC chemistries, properly managed, remain the practical choice for the foreseeable decade.
Frequently Asked Questions
How long do EV batteries last in years and miles?
Modern liquid-cooled EV batteries (2020 and newer) typically retain 85–92% of their original capacity at 100,000 miles. At 200,000 miles, expect 78–88% SoH depending on chemistry and charging habits. In years, most packs will function well beyond 15 years of typical use. LFP chemistry tends to outlast NMC in cycle count, though NMC may perform slightly better in cold climates.
How much does an EV battery cost to replace?
Out-of-warranty replacement costs range from $12,000–$16,000 for a ~60 kWh pack (Tesla Model 3 RWD, Chevy Bolt) to $22,000–$30,000 for a ~131 kWh pack (Ford F-150 Lightning Extended Range). Refurbished packs from third-party suppliers typically cost 30–40% less. However, fewer than 2% of current EVs have needed an out-of-warranty replacement — most packs outlive the vehicle.
What does the EV battery warranty cover?
Manufacturer warranties guarantee that the high-voltage traction battery will retain at least 70% of its original capacity for 8 years / 100,000 miles (most brands) or 10 years / 100,000 miles (Hyundai/Kia). If the pack degrades below this threshold within the warranty period, the manufacturer replaces or refurbishes it at no cost. Warranties do not cover accident damage, flooding, or the 12V auxiliary battery.
LFP vs NMC — which battery chemistry is better?
Neither is universally better; the choice depends on your priorities. LFP offers longer cycle life (3,000–6,000+ cycles), lower cost, and better thermal safety, but with ~20% less energy density — meaning less range for a given pack size. NMC delivers higher range and better cold-weather performance but degrades faster and costs more. For daily commuters who charge at home, LFP's longevity advantage is significant. For road-trippers who need maximum range, NMC remains preferable.
How do I check my EV's battery health?
Most EVs display estimated range at 100% charge in the app or on the dashboard — compare this to the original EPA range to approximate SoH. For more detailed data, use an OBD2 scanner (such as OBDLink MX+) with apps like Car Scanner or ABRP to read BMS-reported SoH, cell voltages, and pack temperature. Check at least once per year or before purchasing a used EV.
Do electric ferries use the same batteries as cars?
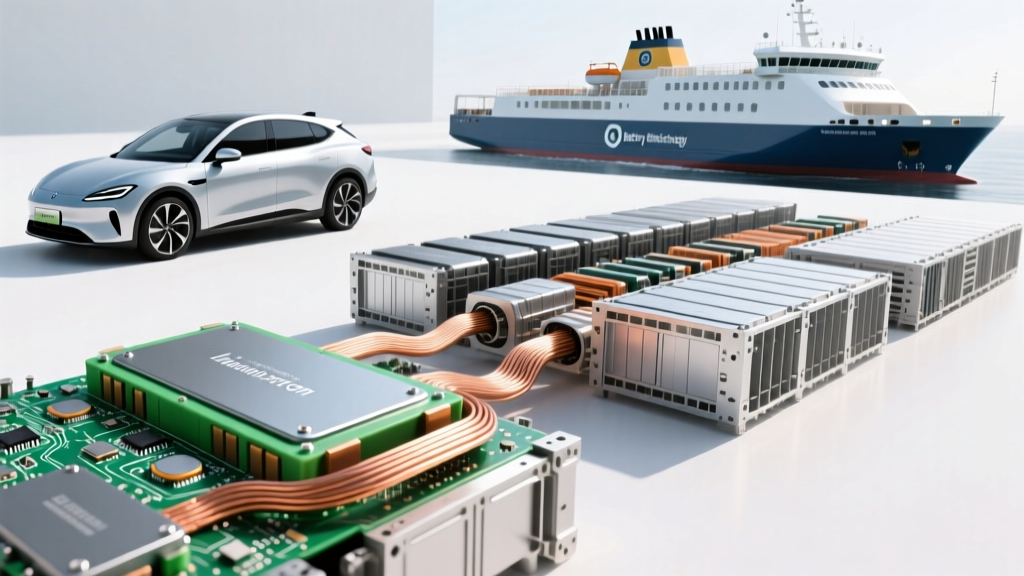
They use the same cell chemistry (LFP or NMC) but in vastly different configurations. A battery system for an electric ferry typically contains 1–5 MWh of capacity — equivalent to 15–75 Tesla Model Y battery packs — arranged in modular, marine-certified racks with IP67 waterproofing and redundant cooling. The cells may come from the same suppliers (CATL, Samsung SDI, EVE Energy), but the pack engineering, thermal management, and BMS are purpose-built for marine duty cycles.