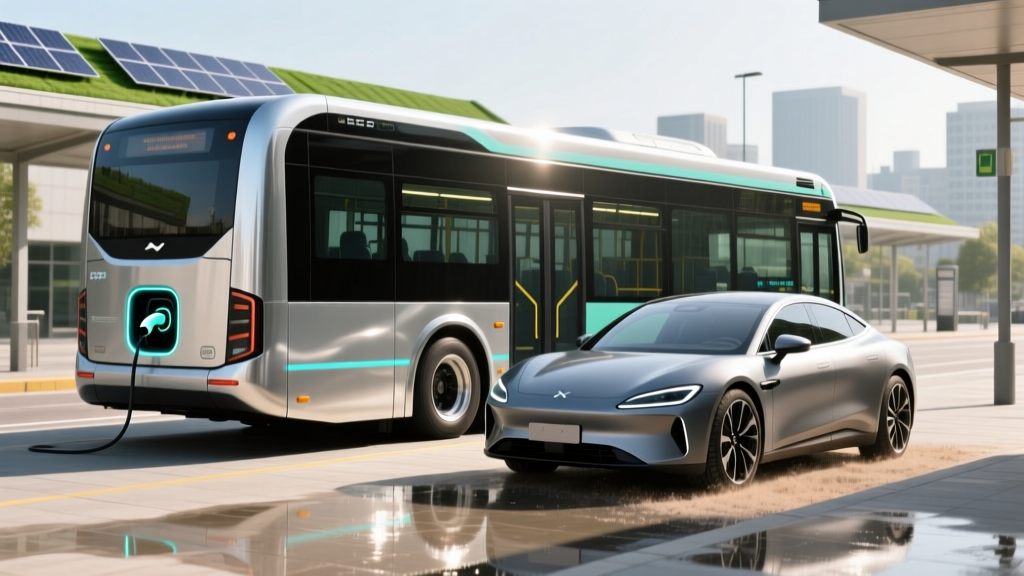
If you've searched for the cost of an electric bus, you've likely found a maze of municipal procurement documents, grant applications, and six-figure price tags. Whether you're a fleet manager evaluating transit electrification, a school district administrator weighing diesel vs. electric school buses, or an EV-curious consumer who stumbled onto this topic wondering how commercial electric vehicles compare to personal EVs, this guide breaks down the real numbers.
We'll cover what electric buses actually cost to buy and operate in 2026, then benchmark those figures against what an individual EV owner spends on a passenger electric car over five years. The economics are surprisingly interconnected — the same battery chemistry, charging infrastructure, and federal incentive frameworks shape both markets.
What Does an Electric Bus Actually Cost in 2026?
Let's start with the headline number. A new 40-foot battery-electric transit bus from a major manufacturer like New Flyer (Xcelsior CHARGE NG), BYD, or Proterra typically carries a base purchase price between $900,000 and $1.4 million in 2026. For context, a comparable diesel transit bus runs roughly $550,000 to $650,000. Electric school buses (Type C, from Blue Bird, Thomas Built/Proterra, or Lion Electric) range from $230,000 to $380,000, versus $110,000 to $130,000 for diesel equivalents.
That upfront premium — often 1.5× to 2× the diesel equivalent — is the single biggest barrier to fleet electrification. But purchase price is only the start of the equation.
| Vehicle Type | Electric Price | Diesel Price | Upfront Premium |
|---|---|---|---|
| 40-ft Transit Bus | $900,000–$1,400,000 | $550,000–$650,000 | +$300,000–$800,000 |
| Type C School Bus | $230,000–$380,000 | $110,000–$130,000 | +$100,000–$270,000 |
| Shuttle/Cutaway (30-ft) | $180,000–$280,000 | $95,000–$120,000 | +$60,000–$180,000 |
The 5-Year Total Cost of Ownership: Electric Bus Breakdown
Fleet operators don't buy buses based on sticker price alone — they evaluate total cost of ownership (TCO) over a 12- to 15-year service life. But for comparison with passenger EVs, let's look at a 5-year window for a 40-foot electric transit bus running approximately 45,000 miles per year (typical urban transit duty cycle).
| Cost Category | 5-Year Total | Per-Mile Cost |
|---|---|---|
| Purchase Price (base) | $1,100,000 | $4.89 |
| Federal/State Grants & Incentives | –$250,000 | –$1.11 |
| Charging Infrastructure (depot) | $180,000 | $0.80 |
| Electricity (5 yrs @ $0.11/kWh avg) | $168,750 | $0.75 |
| Maintenance & Parts | $112,500 | $0.50 |
| Insurance | $75,000 | $0.33 |
| Depreciation (5-yr residual ~35%) | $385,000 | $1.71 |
| Net 5-Year TCO | $1,771,250 | $7.87/mile |
That electricity figure assumes an average consumption of 2.1 kWh/mile (realistic for a loaded 40-foot transit bus in mixed urban service) and a blended depot charging rate of $0.11/kWh, which reflects commercial/industrial utility rates with time-of-use optimization. Diesel at $3.90/gallon and 4.5 MPG would cost roughly $0.87/mile in fuel alone — so the electric bus saves about $0.12/mile on energy, though the infrastructure investment partially offsets that gain in the early years.
By year 7 to 10, as the infrastructure cost is amortized and diesel prices fluctuate upward, the TCO crossover point typically favors electric — which is why agencies like the EPA's Clean School Bus Program have funded thousands of electric bus deployments.
Federal Tax Credits and Incentives: Buses vs. Passenger EVs
Here's where the bus buyer's journey diverges sharply from the passenger EV buyer's. Electric buses generally do not qualify for the IRS §30D Clean Vehicle Credit that passenger EV buyers use. The §30D credit applies to light-duty vehicles under specific MSRP and buyer income caps. Instead, commercial and heavy-duty electric vehicles rely on a different incentive stack.
For Passenger EV Buyers: IRS §30D Credit (2026 Rules)
If you're reading this to compare bus economics with your own potential EV purchase, here's a precise refresher on the federal tax credit for personal electric vehicles under current IRS §30D guidelines:
- Credit amount: Up to $7,500 (split: $3,750 for critical minerals + $3,750 for battery component sourcing)
- MSRP caps: Vans/SUVs/pickups ≤ $80,000; sedans ≤ $55,000
- Buyler income limits (AGI): $300,000 joint / $225,000 head of household / $150,000 single
- Battery sourcing: Critical minerals and battery components must meet escalating domestic/free-trade-partner percentages — vehicles with FEOC (foreign entity of concern) battery components are disqualified
- Point-of-sale transfer: Eligible buyers can transfer the credit to the dealer at purchase, reducing the sale price directly (effective Jan 2024 onward)
- Vehicle assembly: Final assembly must occur in North America
These rules have tightened significantly since the Inflation Reduction Act's passage. Many popular models that qualified in 2023 no longer meet battery-sourcing thresholds in 2026. Always verify eligibility on the fueleconomy.gov tax credit database before committing to a purchase.
For Bus Buyers: Commercial EV Incentives
Electric bus purchasers tap a different well of funding:
Key incentive programs for electric buses (2026):
- EPA Clean School Bus Program: Up to $375,000 per electric school bus + $20,000 for charging infrastructure (funded through 2026 via IRA)
- FTA Low-No Emission Vehicle Program: Federal transit grants covering up to 85% of bus cost + 80% of infrastructure
- IRS §45W Commercial Clean Vehicle Credit: Up to $40,000 for qualified commercial EVs (GVWR > 14,000 lbs), subject to sourcing rules
- State/Regional programs: California HVIP, New York Voucher Program, and similar — rebates from $50,000 to $175,000 per bus depending on jurisdiction
- Utility make-ready programs: Many utilities cover depot charging infrastructure costs partially or fully
Note: State and local incentives vary significantly by region, utility territory, and available funding. Consult your state energy office and local utility for current program availability.
Charging Cost vs. Diesel: The Per-Mile Math
Whether you're operating a 40-foot transit bus or a personal EV crossover, the energy-cost advantage of electrons over fossil fuel is real — but the exact savings depend on your specific rates and usage patterns.
| Vehicle | Energy Source | Efficiency | Cost/Unit | Cost Per Mile |
|---|---|---|---|---|
| 40-ft Electric Bus | Electricity (depot) | 2.1 kWh/mi | $0.11/kWh | $0.23 |
| 40-ft Diesel Bus | Diesel | 4.5 MPG | $3.90/gal | $0.87 |
| 2026 Tesla Model Y (LR) | Electricity (home L2) | 0.28 kWh/mi | $0.14/kWh | $0.039 |
| 2026 Toyota RAV4 (gas) | Gasoline | 30 MPG | $3.40/gal | $0.113 |
For the bus operator, the per-mile energy savings of roughly $0.64/mile translate to approximately $28,800 saved annually at 45,000 miles/year. Over a 12-year bus service life, that's $345,600 in fuel savings — enough to offset a significant portion of the upfront electric premium.
For the passenger EV owner charging at home on a typical residential rate, the savings versus a gas car are even more dramatic on a percentage basis: roughly $0.074/mile saved, or about $1,100/year at 15,000 miles driven annually.
One critical caveat: public DC fast charging at networks like Electrify America or EVgo often costs $0.35–$0.55/kWh, which can push a passenger EV's per-mile cost to $0.10–$0.15/mile — essentially eliminating the fuel-cost advantage over gasoline for road-trip-heavy drivers. Bus fleets avoid this by charging at depot rates.
Maintenance Savings: Fewer Moving Parts, Real Dollars
Electric drivetrains eliminate a long list of maintenance items that diesel and gasoline vehicles require. This applies to both buses and passenger EVs, though the dollar magnitudes differ enormously.
| Maintenance Item | Electric Bus | Diesel Bus | Passenger EV | Gas Car |
|---|---|---|---|---|
| Oil & Filter Changes | $0 | $2,800 | $0 | $180 |
| Transmission Service | $0 | $1,200 | $0 | $150 |
| Brake Pads/Rotors | $800 (regen extends life 2-3×) | $3,500 | $100 (regen) | $300 |
| Emissions/DPF/DEF | $0 | $2,400 | $0 | $0 |
| Coolant & Fluids | $400 | $900 | $80 | $120 |
| Estimated Annual Total | $1,200 | $10,800 | $180 | $750 |
For transit buses, the maintenance savings are the second-largest TCO advantage after fuel — often cited at $0.30–$0.50/mile saved versus diesel. Regenerative braking is a major contributor: by using the electric motor to decelerate and recapture energy, friction brake wear drops dramatically. Many electric buses reach 150,000+ miles before needing brake pad replacement, versus 40,000–60,000 miles for diesel buses in stop-and-go service.
For passenger EVs, the savings are more modest in absolute dollars but still meaningful: Consumer Reports estimates EV owners save an average of $4,600 in maintenance over the vehicle's lifetime compared to gas-car owners. No oil changes, no spark plugs, no timing belts, no catalytic converters to replace.
Insurance: The Cost Category Where EVs Lose
Here's where the honest TCO picture requires a reality check. EVs are typically more expensive to insure than comparable gas vehicles — and this applies to both personal EVs and electric buses.
For passenger EVs, insurance premiums run 10% to 25% higher than equivalent gas models. A 2026 Tesla Model Y or Ford Mustang Mach-E might cost $1,800–$2,400/year to insure, versus $1,400–$1,800 for a Toyota RAV4 or Honda CR-V. The reasons are structural:
- Higher repair costs: Battery packs are expensive to replace if damaged ($8,000–$22,000 for a passenger EV). Even minor collision damage near the battery enclosure can trigger full-pack replacement protocols.
- Specialized labor: EV repair requires high-voltage-certified technicians, which are still in limited supply, driving up labor rates.
- Higher vehicle values: EVs generally carry higher MSRPs than gas equivalents, so collision/comprehensive payouts are larger.
- Total-loss thresholds: Insurers may declare an EV a total loss at lower damage thresholds due to battery-safety uncertainty.
For electric buses, the insurance dynamic is similar but operates through commercial fleet policies. Premiums are often 15%–20% higher than diesel fleet policies, driven by battery replacement cost exposure and the relative newness of electric bus technology in actuarial models.
This insurance premium gap is gradually narrowing as EV repair networks expand, battery repair (rather than full replacement) becomes more common, and actuarial data catches up with real-world claim experience. But in 2026, it remains a real line item that partially offsets fuel and maintenance savings.
Depreciation and Resale Value: The Evolving Picture
EV depreciation has been a moving target. The early 2020s saw brutal depreciation for some models — Tesla's aggressive price cuts in 2023-2024 hammered resale values across the entire EV market, with some 2-year-old EVs retaining only 45%–55% of original MSRP.
By 2026, the picture has stabilized somewhat but remains less favorable than gas vehicles on average:
- 5-year retention (passenger EVs): 35%–50% of MSRP, varying heavily by brand, model, and battery health
- 5-year retention (gas vehicles): 45%–60% of MSRP on average
- Key depreciation drivers for EVs: Battery degradation data (or fear thereof), rapid technology obsolescence (faster-charging newer models), and manufacturer price wars
- Bright spots: Models with strong battery warranties (8 years/100,000 miles minimum is standard) and proven low-degradation chemistries like LFP (lithium iron phosphate) tend to hold value better
For electric buses, depreciation is calculated differently — fleet vehicles are typically depreciated over 12-15 years, and residual values are heavily influenced by battery state-of-health (SoH) data and the remaining warranty coverage. A bus with a documented 90%+ battery SoH at year 5 commands a significantly higher resale or second-life value than one with opaque battery history.
The emerging second-life battery market (repurposing degraded EV batteries for stationary storage) is creating a floor value for used electric bus batteries that didn't exist five years ago, modestly improving residual projections.
So, How Does the Cost of an Electric Bus Compare to Owning a Passenger EV?
The short answer: they operate on completely different scales but follow the same economic logic.
A 40-foot electric transit bus costs roughly $1.1 million to purchase and approximately $1.77 million over 5 years of operation (before grants). A personal EV like a 2026 Hyundai Ioniq 5 or Tesla Model Y costs $40,000–$52,000 to purchase and approximately $32,000–$42,000 over 5 years of ownership (after tax credits). In both cases:
- The upfront premium over combustion alternatives is real but declining
- Fuel/energy savings are substantial and predictable
- Maintenance savings are significant and well-documented
- Insurance costs are higher and partially offset operational savings
- Incentives are essential to making the math work — but they come with eligibility complexity
- Depreciation remains the most uncertain variable in the TCO equation
For fleet managers, the crossover point where electric TCO undercuts diesel typically arrives around year 6–8, depending on duty cycle, electricity rates, and grant funding. For individual buyers, the break-even versus a gas car often arrives around year 3–5, depending on miles driven, home charging access, and whether the §30D credit applies.
How much does it really cost to own an EV over 5 years?
For a typical 2026 passenger EV (e.g., Tesla Model Y, Hyundai Ioniq 5) driven 15,000 miles/year with home Level 2 charging, expect a 5-year TCO of approximately $32,000–$42,000 after federal tax credits. This includes purchase price (net of credit), electricity (~$2,900), insurance (~$10,500), maintenance (~$900), and depreciation. A comparable gas car's 5-year TCO typically runs $35,000–$48,000. The EV usually wins on TCO, but the margin depends heavily on your electricity rate, insurance premium, and the specific model's depreciation curve.
Do I qualify for the federal tax credit?
Under current 2026 IRS §30D rules, you may qualify for up to $7,500 if your adjusted gross income is under $300,000 (joint), $225,000 (head of household), or $150,000 (single), the vehicle MSRP is under $80,000 (SUVs/vans/trucks) or $55,000 (sedans), the vehicle's battery meets critical-mineral and component-sourcing requirements, and final assembly occurred in North America. Check the specific vehicle on fueleconomy.gov before purchasing — eligibility changes as battery supply chains shift.
How much do I save on fuel and maintenance?
A typical passenger EV owner charging at home at $0.14/kWh saves approximately $1,100/year on fuel versus a 30 MPG gas car. Maintenance savings average $500–$600/year (no oil changes, minimal brake wear from regenerative braking, no exhaust system service). Combined, that's roughly $1,600–$1,700 in annual operational savings. For electric buses, the savings scale up dramatically: $28,000+/year in fuel and $9,000+/year in maintenance versus diesel.
Are EVs more expensive to insure?
Yes, typically 10%–25% more expensive than comparable gas vehicles. The gap is driven by higher repair costs (especially battery-related), specialized labor requirements, and higher vehicle values. Shop multiple insurers — some now offer EV-specific policies with competitive rates. The insurance premium gap is narrowing as the repair ecosystem matures.
How well do EVs hold their value?
Average 5-year resale retention for EVs is approximately 35%–50% of MSRP in 2026, trailing gas vehicles (45%–60%). The gap is driven by battery degradation concerns, rapid technology improvement cycles, and past manufacturer price cuts. LFP battery models and vehicles with strong warranty coverage tend to depreciate less. The used-EV market is maturing, and depreciation rates are gradually improving as battery longevity data accumulates.