Why Battery Production Equipment Matters to EV Buyers
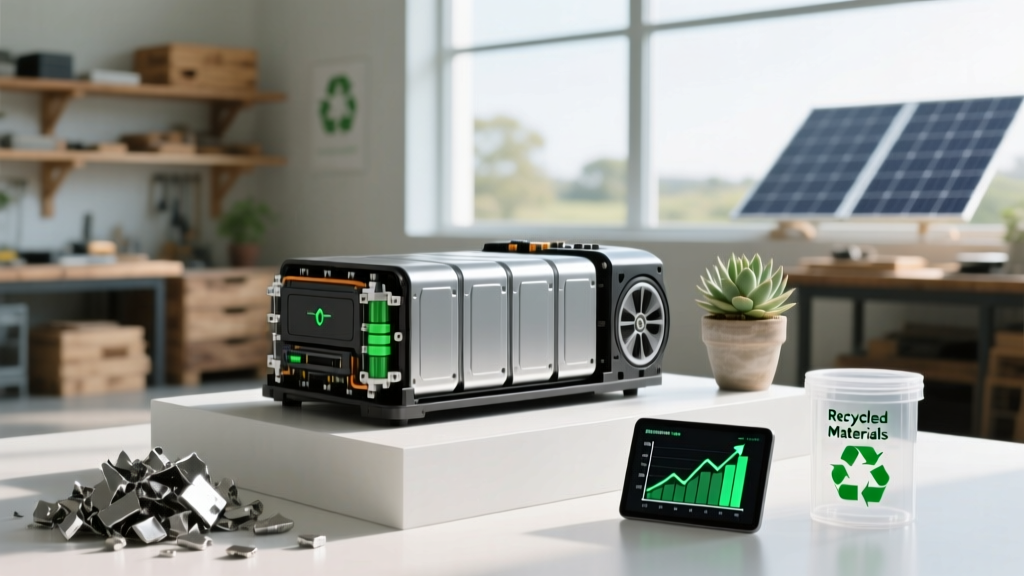
Most EV shoppers focus on range, price, and styling — but the manufacturing process behind the battery pack influences every one of those factors. The battery production equipment used on factory lines — from electrode coaters and cell winders to formation and grading systems — directly determines whether your pack uses LFP or NMC chemistry, how consistently cells are matched, and ultimately how your battery degrades over 100,000+ miles. Understanding this link between manufacturing precision and real-world ownership helps you make a smarter purchase decision.
This guide breaks down the chemistry choices that modern production lines enable, the degradation data you should expect, warranty protections, replacement costs, and practical care strategies — all grounded in 2026 model-year vehicles and current market pricing.
LFP vs NMC/NCA: The Chemistry Decisions Shaped on the Production Line
Two dominant lithium-ion chemistries power today's EVs: LFP (lithium iron phosphate) and NMC (nickel manganese cobalt) or its close relative NCA (nickel cobalt aluminum). The battery production equipment required for each differs in subtle but meaningful ways — LFP cathode coating processes operate at different slurry viscosities and drying temperatures than NMC lines, and cell manufacturers like CATL, BYD, LG Energy Solution, and Panasonic configure dedicated production lines for each chemistry.
For buyers, the trade-offs are concrete:
| Attribute | LFP (e.g., Tesla Model 3 RWD, BYD Seal, Ford Mustang Mach-E Select) | NMC/NCA (e.g., Tesla Model Y LR, Hyundai Ioniq 5, BMW iX) |
|---|---|---|
| Energy Density (cell-level) | ~160–180 Wh/kg | ~230–300 Wh/kg |
| Typical Pack Size | 50–65 kWh usable | 72–100+ kWh usable |
| EPA Range (common models) | 240–272 mi | 300–370+ mi |
| Cycle Life | 3,000–5,000+ cycles to 80% SoH | 1,000–2,000 cycles to 80% SoH |
| Cold-Weather Range Loss (~20°F) | ~30–40% reduction | ~20–30% reduction |
| Fast-Charging Tolerance | Excellent — tolerates frequent DCFC | Good — but repeated 250 kW+ sessions accelerate wear |
| Cost per kWh (pack-level, 2026) | ~$95–$115 | ~$125–$155 |
| Cobalt/Nickel Content | None (lower supply-chain risk) | Contains nickel + cobalt or aluminum |
| Best For | Daily commuters, L2 home charging, budget-conscious buyers | Long-range road trippers, cold-climate drivers, performance trims |
The precision of electrode coating equipment — which applies cathode material to aluminum foil at thickness tolerances of ±1–2 micrometers — is what allows manufacturers to hit these energy-density targets consistently. Lower-tier production lines yield wider cell-to-cell variation, which forces the battery management system (BMS) to limit usable capacity to protect weaker cells. This is why two EVs with nominally identical kWh ratings can deliver different real-world range.
How Long Do EV Batteries Actually Last?
The short answer: far longer than most buyers assume. Data from fleet operators, manufacturer warranty claims, and independent testing consistently shows that modern EV batteries retain 85–95% of original capacity after 100,000 miles. Catastrophic failure (requiring full pack replacement) is rare — well under 1% of vehicles in most model lines.
Typical Degradation Curve — Real-World Data Points
| Milestone | NMC/NCA Average Capacity Retained | LFP Average Capacity Retained | Source/Context |
|---|---|---|---|
| 1 year / 15,000 mi | ~96–98% | ~97–99% | Owner-reported fleet averages |
| 3 years / 45,000 mi | ~92–95% | ~95–98% | Recurrent Auto, Geotab fleet data |
| 5 years / 75,000 mi | ~88–93% | ~93–97% | Manufacturer warranty threshold period |
| 8 years / 100,000 mi | ~83–90% | ~90–95% | Warranty coverage endpoint; most packs well above 70% threshold |
| 10 years / 150,000 mi | ~78–87% | ~87–93% | Projected from fleet extrapolation |
Note: Degradation is non-linear — the steepest loss occurs in the first 10,000–20,000 miles (calendar aging + initial SEI layer formation), then the curve flattens significantly. Data from Geotab's fleet analysis and Recurrent Auto.
The manufacturing precision enabled by advanced battery production equipment — particularly in cell formation cycling and capacity grading — is what produces this consistency. During formation, every new cell undergoes controlled charge-discharge cycles on specialized equipment to stabilize the solid electrolyte interphase (SEI) layer. Cells are then graded into matched groups so that a finished pack has uniform internal resistance and capacity across hundreds or thousands of cells.
What the Battery Warranty Actually Covers
Federal law mandates a minimum battery warranty of 8 years / 100,000 miles for EVs sold in the US (California and states adopting CARB standards require 10 years / 150,000 miles). The warranty guarantees that the battery will retain a minimum percentage of its original usable capacity — typically 70%, though some manufacturers set the bar at 65% or 75%.
| Manufacturer / Model | Warranty Period | Capacity Retention Threshold | Chemistry |
|---|---|---|---|
| Tesla Model 3 RWD | 8 yr / 100,000 mi | 70% | LFP |
| Tesla Model Y Long Range | 8 yr / 120,000 mi | 70% | NMC |
| Hyundai Ioniq 5 | 10 yr / 100,000 mi | 70% | NMC |
| Ford Mustang Mach-E | 8 yr / 100,000 mi | 70% | NMC / LFP (trim-dependent) |
| BMW iX xDrive50 | 8 yr / 100,000 mi | 70% | NMC |
| Chevrolet Equinox EV | 8 yr / 100,000 mi | 60% (Ultium platform) | NMC |
What's covered: Capacity loss below the threshold, manufacturing defects, cell imbalance leading to fault codes, and BMS failures.
What's typically excluded: Damage from accidents, flooding, unauthorized modifications, or use outside manufacturer guidelines (e.g., persistent charging to 100% on NMC vehicles where the manual recommends 80% daily). Always read your specific warranty booklet — terms vary.
EV Battery Replacement Cost: When and How Much
Full battery pack replacement is uncommon within the warranty period and often unnecessary during the vehicle's useful life. When it is needed — usually on high-mileage vehicles beyond 150,000 miles or after physical damage — costs have declined substantially thanks to improved battery production equipment efficiency and scaled manufacturing.
| Vehicle / Pack Size | Chemistry | Estimated Pack + Labor Cost | Notes |
|---|---|---|---|
| Tesla Model 3 RWD (~60 kWh) | LFP | $8,000–$12,000 | LFP packs are cheaper; module-level repair sometimes possible |
| Hyundai Ioniq 5 (~77.4 kWh) | NMC | $12,000–$16,000 | Modular pack allows partial replacement |
| Ford F-150 Lightning Ext. Range (~131 kWh) | NMC | $20,000–$28,000 | Large pack; labor-intensive removal |
| Chevrolet Silverado EV (~200 kWh) | NMC (Ultium) | $25,000–$35,000 | Largest consumer pack; module service available |
| BMW iX (~105 kWh usable) | NMC | $18,000–$24,000 | Dealer-only replacement; limited third-party options |
Important context: pack-level prices have fallen from ~$200/kWh in 2020 to roughly $110–$140/kWh in 2026, driven by advances in dry-electrode coating equipment, higher-speed cell winding machines, and yield improvements in formation/grading. Many service centers now offer module-level repair — replacing individual defective modules rather than the entire pack — for $2,000–$6,000 depending on the vehicle. Ask your dealer whether module service is available before authorizing a full pack swap.
Factors That Accelerate (or Preserve) Battery Life
Battery degradation isn't purely a function of time and mileage — your habits and environment play a measurable role. Here's what the data shows:
Battery Care Checklist — Maximize Longevity
- Limit DC fast-charging frequency: Occasional road-trip DCFC use is fine, but daily 150–250 kW sessions on NMC packs can add 1–3% additional degradation over 100,000 miles compared to Level 2 home charging. LFP tolerates DCFC better.
- Avoid extreme State of Charge (SoC) storage: For NMC, store between 20–80% SoC when the vehicle will sit for days or weeks. LFP owners can charge to 100% regularly (Tesla recommends weekly 100% charges for LFP calibration).
- Precondition before fast charging: Battery preconditioning warms the pack to ~30–35°C, enabling faster charging and reducing lithium plating risk. Most EVs auto-precondition when you navigate to a charger — use this feature.
- Park in shade or a garage in summer: Sustained high battery temperatures (>95°F ambient, >110°F pack) accelerate calendar aging. Thermal management systems help but aren't infinitely effective when parked unplugged.
- Use Level 2 for daily charging: A home Level 2 charger (7–11.5 kW) is the gold standard for battery longevity. Slow, steady charging generates less heat and stress than repeated DCFC sessions.
- Don't obsess over 100% avoidance on LFP: LFP chemistry benefits from periodic full charges to recalibrate the BMS. Follow your manufacturer's specific guidance.
The charge curve also matters: most EVs charge fastest between 10–50% SoC, then taper significantly above 80%. A "250 kW peak" charge rate may only sustain for 5–10 minutes before dropping to 100 kW or less. This taper protects the battery but means a 10–80% session is far more time-efficient than 10–100%. For example, the Hyundai Ioniq 5 peaks at ~240 kW and achieves 10–80% in roughly 18 minutes, but pushing from 80–100% adds another 15–20 minutes at declining rates.
How to Monitor Your Battery's State of Health (SoH)
State of Health (SoH) represents your battery's current maximum capacity as a percentage of its original capacity. A new pack is 100% SoH; a pack with 8% degradation sits at 92% SoH. Monitoring SoH helps you track degradation trends and plan for warranty claims if needed.
Built-In Vehicle Tools
Several 2026 models now display SoH or a battery-health score directly in the infotainment system:
- Hyundai/Kia/Genesis: Battery health percentage accessible via the EV-specific menu in the instrument cluster or infotainment system.
- BMW (iX, i4, i7): Displays battery capacity and health data in the iDrive EV menu.
- Mercedes-Benz (EQS, EQE): Battery health indicator in the MBUX EQ submenu.
- Tesla: No native SoH display in-vehicle, but range-at-full-charge tracking provides a practical proxy. Third-party apps like Tessie or TeslaFi calculate SoH from charge logs.
Third-Party and OBD-II Tools
For vehicles without a built-in SoH display, OBD-II diagnostic tools can read battery management data directly:
- OBDLink MX+ with third-party apps (e.g., Leaf Spy for Nissan, ABRP-linked tools): Reads cell voltages, pack temperature, and estimated SoH.
- Dealer diagnostic scan: Most service departments can print a battery health report during routine service — request one annually, especially as you approach warranty mileage thresholds.
- Geotab / Recurrent Auto: Fleet-oriented tools that track degradation over time; some consumer-facing versions available.
If your SoH drops below the warranty threshold (typically 70%) within the coverage period, document it with a dealer diagnostic report and file a warranty claim. Keep records of all charging habits and service visits to support your case.
Emerging Battery Tech: Solid-State and Silicon Anodes
Next-generation battery technologies are advancing through R&D and pilot production lines, but realistic timelines matter. Here's where things stand in 2026:
Solid-State Batteries
Solid-state cells replace the liquid electrolyte with a solid ceramic, polymer, or sulfide material, promising higher energy density (potentially 400–500 Wh/kg at the cell level), faster charging, and improved safety. Companies like Toyota, Samsung SDI, QuantumScape, and Solid Power have demonstrated prototype cells, but mass-production challenges remain — particularly in manufacturing solid electrolyte layers at scale without cracking or delamination.
Realistic timeline: Limited-production vehicles (likely premium Japanese or Korean models) may appear by 2028–2030. Volume production at competitive pricing is not expected before 2032+. Battery production equipment for solid-state lines is still being developed; dry-room requirements and sintering processes differ fundamentally from current liquid-electrolyte lines.
Silicon Anode Technology
Replacing graphite anodes with silicon (or silicon-carbon composites) can increase cell energy density by 20–40%. Companies like Sila Nanotechnologies, Group14, and Enovix are supplying early silicon-anode materials to cell manufacturers. The challenge: silicon expands ~300% during lithiation, requiring specialized binder materials and production equipment to manage swelling over thousands of cycles.
Realistic timeline: Partial silicon-anode blends (5–15% silicon content) are already in some 2026 model-year cells. Higher-silicon-content anodes for mainstream EVs are expected in the 2028–2031 window.
Frequently Asked Questions
How long do EV batteries last in years and miles?
Most modern EV batteries are designed to last 150,000–200,000+ miles while retaining 75–85% of original capacity. In years, that translates to 12–20 years for average drivers (12,000–15,000 miles/year). Real-world fleet data from Recurrent Auto and Geotab confirms that catastrophic battery failure is rare — well under 1% in most model lines. The battery will very likely outlast other major vehicle components.
How much does an EV battery cost to replace?
Out-of-warranty replacement costs range from ~$8,000 for a smaller LFP pack (e.g., Tesla Model 3 RWD, ~60 kWh) to $28,000–$35,000 for large NMC packs (e.g., F-150 Lightning Extended Range, Silverado EV). Module-level repair — replacing individual defective modules rather than the full pack — is increasingly available for $2,000–$6,000. Costs continue to decline as manufacturing scales. Most owners never face this expense during their ownership period.
What does the EV battery warranty cover?
Federal law requires a minimum 8-year/100,000-mile battery warranty (10 years/150,000 miles in CARB states). The warranty guarantees the battery will retain at least 60–70% of its original capacity (threshold varies by manufacturer). It covers defects, premature degradation, and BMS failures. It does not cover accident damage, unauthorized modifications, or abuse. Check your specific warranty booklet for exact terms. Refer to EPA emissions warranty requirements for regulatory baseline.
How do I check and maximize my EV battery health?
Check SoH through your vehicle's built-in battery health display (Hyundai, BMW, Mercedes), third-party OBD-II tools, or dealer diagnostic scans. To maximize longevity: prioritize Level 2 home charging over daily DC fast charging, avoid storing NMC packs at 100% or below 10% for extended periods, precondition before fast charging, and park in temperature-moderate environments when possible. LFP owners should charge to 100% at least weekly for BMS calibration.
LFP vs NMC — which battery chemistry is better?
Neither is universally better — it depends on your driving pattern. Choose LFP if you commute daily, charge at home on Level 2, want the longest cycle life (3,000–5,000+ cycles), and don't need 300+ mile range. Choose NMC/NCA if you take frequent road trips, drive in cold climates (better cold-weather range retention), need maximum range per charge, or want the fastest 0–60 performance. The battery production equipment behind each chemistry has matured to the point where both are reliable choices — the decision is about your use case, not quality concerns.
Does frequent DC fast charging damage my battery?
Occasional DC fast charging (road trips, a few times per month) has minimal impact on modern batteries thanks to sophisticated thermal management and charge-curve tapering. However, daily DCFC use on NMC packs — especially at 250+ kW — can accelerate degradation by 1–3% over 100,000 miles compared to Level 2 charging. LFP packs handle frequent DCFC better. For daily charging, a home Level 2 setup (7–11.5 kW) remains the best practice for battery longevity.