Quick Answer: Is the U.S. Electric Bus Market Ready for Fleet Adoption?
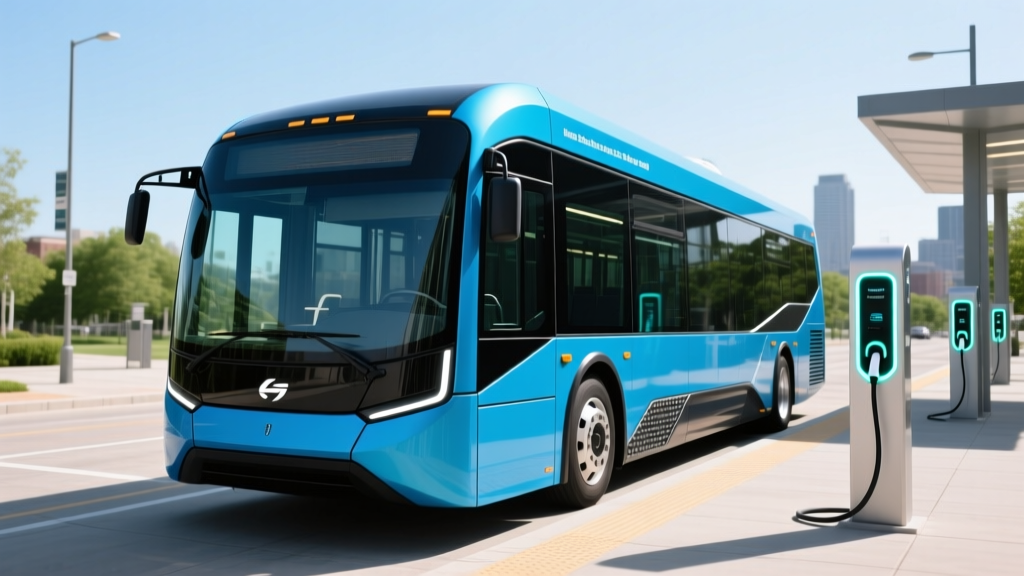
The United States electric bus market has reached a practical inflection point for transit agencies and private fleet operators in 2026. A standard 40-foot battery-electric transit bus now delivers an EPA-estimated 220–280 miles of range on a 400–550 kWh LFP (lithium iron phosphate) battery pack, with depot-level DC fast charging at 150–350 kW adding roughly 60–120 miles per hour of charging. Purchase prices range from $750,000 to $1.2 million before federal and state incentives — roughly 1.5–2× the cost of a comparable diesel bus — but lifetime fuel and maintenance savings of $350,000–$500,000 over a 12-year service life frequently close the gap. For operators running fixed routes under 200 miles daily with depot charging access, electric buses are cost-competitive today. For long-haul, intercity, or extreme-cold routes, diesel and CNG remain more practical in 2026.
What Is Driving the United States Electric Bus Market in 2026?
The U.S. electric bus market has expanded steadily since the EPA's Clean Bus Program allocated $5 billion through the Bipartisan Infrastructure Law for zero-emission school and transit buses. As of 2026, battery-electric buses represent roughly 8–12% of new transit bus orders nationally, with higher penetration in states like California, New York, and Washington that have enacted zero-emission fleet mandates. Manufacturers including New Flyer (Xcelsior CHARGE NG), Proterra (now restructured under Phoenix Motorcars), BYD, Gillig, and Thomas Built Buses (for school buses) are delivering at scale.
The market is segmented into three primary categories:
- Transit buses (40-foot and 60-foot articulated): The largest segment, serving municipal transit agencies on fixed routes.
- School buses (Type C and Type D): Growing rapidly under EPA Clean School Bus funding; Blue Bird, IC Bus, and Thomas Built all offer battery-electric models.
- Coach/intercity buses: Still early-stage; battery weight and range limitations make diesel dominant for routes exceeding 250 miles.
Federal incentives remain significant. The EPA Clean School Bus Program offers up to $375,000 per zero-emission school bus plus $20,000 for charging infrastructure, while transit agencies can access FTA Low-No Program grants. However, these programs are competitive and oversubscribed — fleets should not assume guaranteed funding.
Range, Battery Specs, and Real-World Performance
Electric bus buyers need to evaluate range claims against operational reality. Here are the specs for representative 2026 models:
| Model | Battery (kWh usable) | Chemistry | EPA Range (mi) | Real-World Range (mi) | Peak DC Charge (kW) |
|---|---|---|---|---|---|
| New Flyer Xcelsior CHARGE NG (40-ft) | ~525 kWh | LFP | 260 | 190–230 | 350 kW (CCS) |
| Gillig Battery Electric (40-ft) | ~444 kWh | NMC | 238 | 175–210 | 250 kW (CCS) |
| Blue Bird Vision Electric (School) | ~155 kWh | LFP | 130 | 95–120 | 85 kW (CCS) |
| Thomas Built Saf-T-Liner C2 Jouley (School) | ~226 kWh | LFP | 150 | 110–135 | 120 kW (CCS) |
Real-World Range Reality Check
EPA range figures for electric buses assume moderate temperatures, flat terrain, and partial passenger loads. In practice, fleet operators should plan for:
- Cold weather (below 32°F): Expect 25–40% range loss due to cabin heating and reduced battery efficiency. A bus rated at 260 miles EPA may deliver only 155–195 miles in a Minnesota winter.
- Hilly terrain: Routes with sustained grades over 4% can reduce range by 15–20%.
- Full passenger loads + HVAC: Maximum occupancy with summer A/C running can cut range by 10–15%.
- Highway-speed operation: Transit buses running sustained 55–65 mph on express routes lose 10–20% range vs. stop-and-go city driving (where regenerative braking recovers energy).
Bottom line: spec your battery for your worst-case day, not your average day.
Charging Infrastructure: Depot, Opportunity, and Overhead
Unlike passenger EVs, electric buses require purpose-built charging infrastructure that often represents 20–40% of the total electrification project cost. There are three primary charging strategies:
| Charging Method | Power (kW) | Typical Use Case | Miles Added per Hour | Infrastructure Cost per Charger |
|---|---|---|---|---|
| Depot Level 2 (AC) | 19.2–40 kW | Overnight charging, school buses | 8–18 mi/hr | $15,000–$40,000 |
| Depot DC Fast (CCS) | 60–150 kW | Overnight + midday top-off | 25–65 mi/hr | $80,000–$180,000 |
| High-Power Depot DC | 150–350 kW | Fast turnaround, large fleets | 60–140 mi/hr | $150,000–$350,000 |
| Opportunity (Pantograph) | 150–450 kW | On-route midday top-off | 60–180 mi/hr | $300,000–$600,000 |
Most transit agencies deploying 10+ buses opt for depot DC fast charging at 150 kW per stall, which can fully charge a 500 kWh bus overnight in 4–5 hours while managing demand charges through staggered scheduling. Opportunity charging via overhead pantograph (SAE J3105) is used on high-frequency routes where midday top-offs extend operational range, but infrastructure costs are substantial.
Utility demand charges are a frequently overlooked cost. A depot with 20 chargers pulling 150 kW simultaneously draws 3 MW — enough to trigger demand charges of $10–$25 per peak kW per month from many utilities, adding $30,000–$75,000 monthly in some rate structures. Smart charge management software (e.g., ChargePoint, Nuvve, Amply Power) that staggers charging and caps peak draw can reduce demand charges by 40–60%.
Total Cost of Ownership: Electric Bus vs. Diesel
The upfront price premium of electric buses is real, but the total cost of ownership (TCO) over a 12-year service life tells a different story for most fixed-route operators. Here is a side-by-side comparison for a 40-foot transit bus:
| Cost Category | Battery-Electric Bus (40-ft) | Diesel Bus (40-ft) | CNG Bus (40-ft) |
|---|---|---|---|
| Purchase Price (base) | $900,000–$1,100,000 | $500,000–$600,000 | $550,000–$650,000 |
| Federal/State Incentives | –$150,000 to –$400,000 | $0 | $0–$25,000 |
| Charging/Fueling Infrastructure (amortized) | $80,000–$150,000 | $5,000–$15,000 | $30,000–$60,000 |
| Fuel/Energy (12 years, ~50k mi/yr) | $110,000–$170,000 | $280,000–$380,000 | $200,000–$280,000 |
| Maintenance (12 years) | $90,000–$130,000 | $180,000–$250,000 | $160,000–$220,000 |
| Battery Replacement (mid-life) | $120,000–$200,000 (if needed) | N/A | N/A |
| Estimated 12-Year TCO | $1.05M–$1.45M | $0.96M–$1.23M | $0.94M–$1.21M |
Key observations from this comparison:
- Fuel savings are substantial: Electricity at $0.12–$0.18/kWh yields an energy cost of roughly $0.45–$0.65 per mile for a transit bus (consuming ~2.0–2.5 kWh/mi), versus $0.90–$1.20/mile for diesel at $3.80–$4.50/gallon and 4.5–5.5 MPG.
- Maintenance savings are real but not unlimited: Electric buses eliminate engine oil, coolant flushes, DPF filters, and transmission fluid changes. However, suspension, HVAC, brake (reduced but not eliminated due to regen), and body maintenance remain. Expect 40–55% lower maintenance costs vs. diesel.
- Battery replacement is the wildcard: Most manufacturers warrant batteries for 8–12 years or 70–80% capacity retention. If a mid-life pack swap is needed at year 8–10, the $120,000–$200,000 cost can erode TCO advantages. LFP chemistry, now standard on most new models, offers longer cycle life (3,000–5,000 cycles to 80% SoH) and may avoid replacement entirely within a 12-year service window.
- Incentives tip the scale: With FTA Low-No grants, EPA Clean Bus funding, or state-level vouchers (e.g., California's HVIP), the net purchase price can drop to $500,000–$700,000, making electric TCO clearly lower than diesel.
Common Misconceptions About Electric Buses
| Myth | Fact |
|---|---|
| "Electric buses can't handle cold climates." | Range drops 25–40% in extreme cold, but agencies in Chicago, Minneapolis, and Anchorage operate electric buses successfully by oversizing batteries and using depot preconditioning. Proper route planning accounts for worst-case range. |
| "Battery replacement makes electric buses more expensive." | LFP batteries now last 3,000–5,000+ full cycles. A bus cycling once daily for 12 years uses ~4,380 cycles — within LFP lifespan. Many fleets will retire the bus before needing a pack swap. |
| "The grid can't handle a depot of electric buses." | A 20-bus depot charging at 150 kW draws ~3 MW — equivalent to a large grocery store. Utility upgrades are often needed (new transformer, switchgear), but they are routine commercial electrical projects, not grid-breaking events. Plan 12–24 months for utility coordination. |
| "Electric buses are slower and less powerful." | Modern electric transit buses produce 350–550 HP and 2,500–4,000 lb-ft of torque at the wheels, outperforming diesel equivalents in acceleration. The New Flyer Xcelsior CHARGE NG does 0–30 mph in ~6 seconds — faster than most diesel buses. |
| "Federal funding covers the full cost." | EPA and FTA grants are competitive and typically cover 25–85% of bus cost and 50–100% of charging infrastructure. Most fleets still need to budget 15–75% of project cost from local or state sources. |
Decision Framework: Should Your Fleet Go Electric in 2026?
Choose Battery-Electric Buses If:
- Your daily route mileage is under 200 miles (or under 150 miles in cold climates)
- You have depot space for overnight charging infrastructure
- You qualify for federal/state incentives (EPA Clean Bus, FTA Low-No, state vouchers)
- Your utility offers favorable commercial EV rate structures or demand-charge management
- You operate in an area with zero-emission mandates or clean-air requirements
- You plan to hold buses for 10–12+ years (maximizing lifetime fuel/maintenance savings)
Stick with Diesel or CNG If:
- Your routes regularly exceed 250 miles per day without midday charging opportunities
- You operate in extreme cold (–20°F or below) without heated depot storage
- Your fleet is small (under 5 buses) and infrastructure cost per bus is prohibitive
- You lack access to incentives or utility EV rate programs
- You run intercity/charter service with variable, long-distance routes
- Your depot has no feasible path to utility service upgrade within your timeline
First-Time Electric Bus Buyer Checklist
If your agency or fleet is evaluating its first battery-electric buses, work through these steps before issuing an RFP:
- Audit every route for worst-case daily mileage. Include detour scenarios, deadhead miles, and winter HVAC loads. Your battery spec must cover the longest day, not the average day.
- Engage your utility early. Request a service capacity study for your depot. Utility-side upgrades (new feeder, transformer) can take 12–24 months and cost $100,000–$500,000+ depending on existing infrastructure.
- Model demand charges. Request your utility's commercial EV rate schedule. Compare unmanaged charging (all buses plug in at 6 PM) vs. managed charging (staggered overnight) to quantify savings.
- Apply for incentives before committing. The EPA Clean School Bus Program, FTA Low-No grants, and state programs like California's HVIP have application windows — missing one can delay your project by a year.
- Specify LFP battery chemistry unless you have a specific energy-density requirement (e.g., 60-foot articulated buses). LFP offers longer cycle life, better thermal stability, and lower cost per kWh than NMC.
- Budget for charging infrastructure at 25–40% of total project cost. This includes chargers, electrical switchgear, conduit, utility service upgrades, and charge management software.
- Plan for workforce training. Maintenance technicians need high-voltage safety certification (NFPA 70E) and manufacturer-specific training. Budget $5,000–$15,000 per technician for initial training.
Frequently Asked Questions
How long does it take to charge an electric bus at a depot?
At 150 kW DC fast charging, a 500 kWh battery charges from 10–80% in roughly 2.5 hours and 10–100% in about 3.5 hours. Most fleets charge overnight during off-peak electricity rate windows (typically 10 PM–6 AM), which provides ample time for a full charge. At 60 kW, expect 10–100% in 8–9 hours.
What happens if an electric bus battery degrades below usable capacity?
Most manufacturers warrant battery packs for 8–12 years at 70–80% remaining capacity. If degradation exceeds the warranty threshold, the manufacturer replaces or refurbishes the pack at no cost. Outside warranty, a full pack replacement costs $120,000–$200,000 depending on capacity and chemistry. Some operators plan a mid-life battery refresh at year 8–10 as a budgeted capital expense.
Can electric buses tow or handle steep grades?
Electric buses produce peak torque from 0 RPM, making them strong hill climbers. However, sustained grades above 6% with full passenger loads significantly increase energy consumption (up to 3.5–4.0 kWh/mile vs. 2.0 kWh/mile on flat terrain). Agencies with mountainous routes — e.g., Seattle, San Francisco, Pittsburgh — should spec larger battery packs (500+ kWh) and conduct route-specific energy modeling before ordering.
Do electric buses qualify for the federal §30D tax credit?
No. The IRS §30D clean vehicle credit applies to light-duty vehicles under 14,000 lbs GVWR for personal use. Commercial electric buses qualify instead under §45W (Commercial Clean Vehicle Credit), which provides up to $40,000 for vehicles over 14,000 lbs GVWR, subject to domestic content and sourcing requirements. Consult a tax professional for eligibility specifics, and check current IRS guidance for 2026 rules.
What is the typical electric bus electricity cost per mile?
A 40-foot transit bus averages 2.0–2.5 kWh per mile. At a commercial electricity rate of $0.12–$0.18/kWh (national average for fleet depot charging), that translates to $0.24–$0.45 per mile in energy cost — compared to $0.90–$1.20 per mile for diesel at 4.5–5.5 MPG and $3.80–$4.50/gallon. Over 50,000 annual miles, the energy savings alone total $25,000–$40,000 per bus per year.
Are hydrogen fuel cell buses a better alternative?
Hydrogen fuel cell buses (e.g., New Flyer Xcelsior CHARGE H2) offer 300+ mile range and 10–15 minute refueling, which advantages long routes and cold climates. However, hydrogen fuel costs $8–$15/kg (equivalent to $0.60–$1.10/mile), and fueling infrastructure costs $1–3 million per station. For most urban transit agencies, battery-electric remains the lower-TCO choice in 2026. Fuel cells are better suited for agencies with routes exceeding 250 miles or extreme cold where battery range loss is unacceptable.