Quick Answer: San Francisco's Electric Bus Fleet in 2026
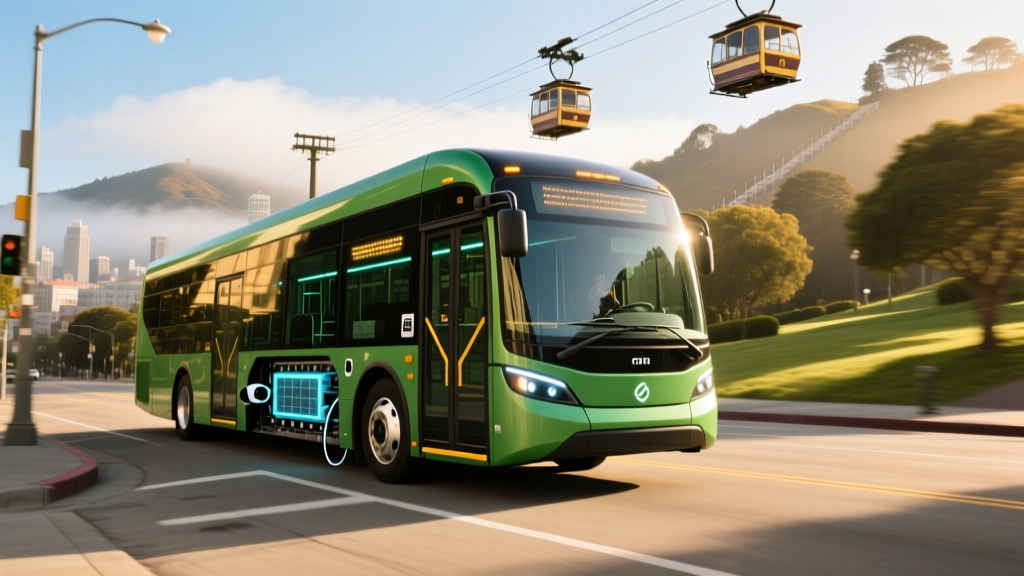
San Francisco's Muni transit system operates a growing fleet of battery-electric buses (BEBs) alongside its legacy trolleybuses (which draw power from overhead wires). As of 2026, the SFMTA has deployed approximately 100+ battery-electric transit buses from manufacturers like New Flyer (Xcelsior CHARGE NG) and BYD, with a goal of full fleet electrification by 2035. These buses typically carry 440–550 kWh battery packs, achieve 200–250 miles of real-world range, and charge via 150–350 kW DC depot chargers or overhead pantograph systems. If you're researching San Francisco electric bus routes, EV transit technology, or what public fleet electrification means for passenger EV adoption, this guide breaks down the numbers, costs, and tech behind the transition.
Why San Francisco Is Going All-Electric on Transit
San Francisco has long been a testing ground for electric mobility. The city's mild climate (rarely below 40°F or above 80°F) is ideal for battery performance — EVs lose 15–30% range in freezing temperatures, a penalty SF transit planners largely avoid. The SFMTA's push toward battery-electric buses aligns with California's Innovative Clean Transit (ICT) regulation, which mandates that all transit agencies transition to zero-emission buses by 2040, with large urban agencies like SF targeting earlier deadlines.
The city already operated one of the largest trolleybus networks in North America — over 300 electric trolleybuses running on 600V DC overhead wires across 15+ routes. But trolleybuses are infrastructure-bound: they can only run where wires exist. Battery-electric buses unlock route flexibility without the $2–4 million per mile cost of installing and maintaining overhead catenary systems.
The Buses: Specs, Battery Chemistry, and Range
San Francisco's BEB fleet primarily consists of heavy-duty transit buses in the 40-foot and 60-foot (articulated) classes. Here's how the key models compare:
| Specification | New Flyer Xcelsior CHARGE NG (XHE40) | BYD K9M (40-ft) | Legacy Trolleybus (ETS II) |
|---|---|---|---|
| Battery Capacity | ~480 kWh (NMC lithium-ion) | ~440 kWh (LFP lithium-ion) | N/A (overhead wire-powered) |
| EPA / Manufacturer Range | ~220–260 mi (real-world) | ~200–250 mi (real-world) | Unlimited (while on wire) |
| DC Fast Charge Rate | Up to 350 kW (CCS) | Up to 150 kW (CCS) | N/A |
| Charge Time (Depot, 0–100%) | ~3–4 hours at 150 kW | ~4–5 hours at 100 kW | N/A |
| Passenger Capacity | ~40 seated / 76 total | ~38 seated / 72 total | ~40 seated / 70 total |
| Approx. Unit Cost | $1.2–1.5 million | $900K–1.1 million | $1.0–1.2 million |
| Battery Warranty | 12 years / performance guarantee | 12 years / 80% capacity retention | N/A |
Battery Chemistry: NMC vs LFP in Transit
New Flyer typically equips its Xcelsior CHARGE NG with NMC (nickel manganese cobalt) cells, which offer higher energy density — critical for fitting enough capacity into a 40-foot bus without exceeding federal weight limits. BYD, as a vertically integrated battery maker, uses its proprietary LFP (lithium iron phosphate) Blade Battery cells. LFP sacrifices some energy density for superior cycle life (3,000–5,000+ cycles vs ~1,500–2,500 for NMC), lower thermal runaway risk, and no cobalt dependency. For a transit agency running buses 18 hours/day, LFP's longevity can offset its weight penalty.
In real-world San Francisco service, range varies significantly by route topography. A bus running the relatively flat N-Judah corridor will consume less energy per mile than one climbing Twin Peaks or the Filbert Street grade. Expect 1.8–2.5 kWh/mile consumption depending on elevation change, passenger load, and HVAC usage.
Charging Infrastructure: Depot and On-Route
Transit bus charging operates on a fundamentally different model than passenger EV charging. SFMTA uses two primary strategies:
Depot Charging (Overnight)
Buses return to yards like the Woods Division and Presidio Division facilities, where they plug into 150–350 kW DC chargers for overnight replenishment. A typical depot might house 20–50 chargers, each drawing power equivalent to 10–15 homes at peak output. SFMTA has invested in utility-scale electrical upgrades — including dedicated medium-voltage feeds and on-site switchgear — to handle the load. PG&E's transit electrification tariffs offer time-of-use rates that make overnight charging cost-effective, with electricity costs around $0.08–0.15/kWh at off-peak hours.
On-Route / Opportunity Charging
For longer or higher-frequency routes, SFMTA has tested pantograph-based opportunity chargers (SAE J3105 standard) at transit terminals. These overhead systems deliver 300–450 kW in 4–8 minute dwell times, adding 20–40 miles of range during a scheduled layover. This approach reduces the battery size needed per bus (saving weight and cost) but requires expensive infrastructure at each charging point — typically $500K–1M+ per station including utility upgrades.
| Charging Type | Power Level | Use Case | Time for Meaningful Charge | Passenger EV Equivalent |
|---|---|---|---|---|
| Depot DC (overnight) | 150–350 kW | Full fleet replenishment | 3–5 hours (full battery) | Level 3 DCFC |
| On-route pantograph | 300–450 kW | Mid-shift top-up | 4–8 min (20–40 mi) | No consumer equivalent |
| Trolleybus overhead wire | ~200 kW continuous | Continuous on-route power | Continuous | No consumer equivalent |
| Consumer DCFC (reference) | 150–350 kW | Road-trip charging | 15–25 min (10–80%) | Tesla Supercharger V4, EA 350 kW |
Electric Bus vs Diesel: Real Cost Comparison
The upfront price of a battery-electric transit bus is roughly 1.5–2x that of a comparable diesel bus (~$750K for a 40-ft diesel). But total cost of ownership over a 12-year transit bus lifecycle tells a different story:
| Cost Category | Battery-Electric Bus (BEB) | Clean Diesel Bus |
|---|---|---|
| Purchase Price | $1,100,000 | $750,000 |
| Federal/State Incentives | –$350,000 (FTA Low-No grants, CARB vouchers) | $0 |
| Fuel / Energy (12 yrs, ~50K mi/yr) | $95,000 (electricity at $0.12/kWh avg) | $320,000 (diesel at $4.50/gal, 4.5 mpg) |
| Maintenance (12 yrs) | $120,000 (no engine/transmission/oil) | $280,000 (DPF, EGR, transmission, oil changes) |
| Battery Replacement (mid-life) | $80,000–$120,000 (if needed, year 8–10) | N/A |
| Charging Infrastructure (amortized) | $60,000 | $0 |
| Estimated 12-Year Total | ~$1,105,000 | ~$1,350,000 |
| Cost Per Mile | ~$1.84 | ~$2.25 |
The ~$245,000 savings per bus over 12 years is why agencies statewide are accelerating adoption. The fuel savings alone — roughly $18,750/year — pay for the price premium within 4–5 years. Factor in California's cap-and-trade funded vouchers through the HVIP program and federal FTA Low-No grants, and the math becomes compelling even for budget-conscious agencies.
Routes and Where You'll Ride an Electric Bus in SF
SFMTA has been strategically deploying BEBs on routes that balance range feasibility with high ridership visibility. As of 2026, battery-electric buses are regularly assigned to routes including:
- Route 14R / 14 — Mission Street corridor, relatively flat, high frequency
- Route 38 / 38R — Geary Boulevard, the city's busiest bus line, partially trolleybus-served with BEB supplementation
- Route 28 / 28R — 19th Avenue, connecting the Sunset to the Golden Gate Bridge
- Route 43 — Masonic to Presidio Heights, moderate hills
- Route 5R / 5 — Fulton Street corridor, western neighborhoods
Routes with extreme grades (like the 24-Divisadero crossing steep hills) were initially avoided for BEBs due to the energy cost of climbing, but as battery capacities have increased from ~350 kWh to 480+ kWh, more hilly routes are becoming feasible. SFMTA publishes real-time vehicle type data through its EV infrastructure pages and GTFS feeds.
What SF's Electric Bus Push Means for Passenger EV Buyers
You might wonder why a transit bus fleet matters if you're shopping for a personal EV. The connection is direct and practical:
Charging Infrastructure Buildout
When SFMTA installs 350 kW DC chargers at bus depots, the utility upgrades (new transformers, medium-voltage lines, switchgear) increase the neighborhood's electrical capacity. This makes it easier and cheaper for nearby commercial properties, apartments, and homes to add their own Level 2 or DC charging. PG&E's EV Infrastructure Rules for transit depot connections often result in upgraded distribution circuits that benefit the surrounding grid.
Public Awareness and Normalization
Every commuter who rides a quiet, smooth-accelerating electric bus instead of a vibrating, diesel-fumed one becomes more likely to consider an EV for their own next car. Studies from the Federal Transit Administration show that riders on BEB routes report higher satisfaction scores than those on diesel routes, particularly regarding noise, vibration, and air quality at stops.
Technology Transfer
The battery packs, thermal management systems, and power electronics in a New Flyer BEB share fundamental engineering with passenger EVs — just scaled up. NMC and LFP cell development driven by transit demand helps reduce per-kWh costs across the entire EV market. When BYD scales its LFP Blade Battery production for thousands of buses, those same cells end up in consumer vehicles at lower prices.
Common Misconceptions About Electric Transit Buses
| Myth | Fact |
|---|---|
| "Electric buses can't handle SF hills" | Modern BEBs with 440–480 kWh packs handle most SF grades. Regen braking on descents recovers 15–25% of climbing energy. Extreme-grade routes were phased in as battery capacity improved. |
| "They run out of charge mid-route" | SFMTA plans routes within 70–80% of rated range as a safety buffer. With 220+ real-world miles available, a typical 120-mile daily block is well within limits. On-route charging covers edge cases. |
| "Electric buses cost taxpayers more" | Higher purchase price is offset by $18,750+/year in fuel savings and ~$13,000/year in maintenance savings within a few years. Federal and state grants cover 30–50% of the upfront premium. |
| "The batteries will end up in landfills" | Transit bus batteries are warranted for 12 years. After retirement, they retain 70–80% capacity and are repurposed for stationary grid storage. Recycling via Redwood Materials and Li-Cycle recovers 95%+ of critical minerals. |
| "Electric buses are slower" | Electric motors deliver instant torque (typically 2,000–3,000 lb-ft at the wheels via axle motors). BEBs accelerate faster from stops than diesels, improving schedule adherence. |
Decision Framework: What This Means for You
If you're a San Francisco resident considering an EV:
- If you ride Muni daily and see electric buses on your route → Your neighborhood's grid is likely being upgraded for higher EV capacity. Home Level 2 installation may be easier and cheaper than in areas without transit electrification. Check with PG&E about your panel's available amperage.
- If you're concerned about EV range on hills → Transit agencies are proving that 40-foot, 40,000-lb electric buses handle SF grades with 200+ mile range. A 4,500-lb passenger EV with 250+ EPA miles will handle the same terrain with far less energy consumption per mile.
- If you're worried about charging infrastructure → The same utility upgrades powering bus depots are expanding neighborhood transformer capacity. SF has one of the highest public charger-per-capita ratios in the US, with 1,500+ public charging ports citywide.
- If you're comparing EV vs hybrid for city driving → Stop-and-go city driving is where EVs shine most. Regenerative braking recovers energy at every stop, and electric motors eliminate the fuel wasted idling. A PHEV like the Toyota RAV4 Prime (42 mi electric range) is a bridge solution if you lack home charging, but a BEV's per-mile cost in SF (PG&E off-peak rates at ~$0.12/kWh) is roughly $0.04/mile vs $0.15–0.20/mile for a 25 mpg gas car at $4.50/gal.
Frequently Asked Questions
How many electric buses does San Francisco have?
As of 2026, SFMTA operates over 100 battery-electric buses alongside its 300+ trolleybus fleet. The agency's target is full zero-emission fleet conversion by 2035, ahead of California's 2040 mandate.
Are San Francisco's trolleybuses the same as battery-electric buses?
No. Trolleybuses draw power continuously from overhead 600V DC wires and have small battery packs only for off-wire maneuvering (typically 1–3 miles). Battery-electric buses carry large 440–480 kWh packs and charge at depots or via on-route pantographs, requiring no overhead wires.
How far can a San Francisco electric bus go on a single charge?
Real-world range is typically 200–250 miles depending on route topography, passenger load, and HVAC use. This is sufficient for most Muni route blocks, which average 100–150 miles per day.
Does riding an electric bus produce zero emissions?
At the tailpipe, yes — zero. Upstream, the answer depends on the grid. As of 2026, PG&E's electricity mix is approximately 55–60% renewable (solar, wind, hydro, geothermal), with the state targeting 100% clean electricity by 2045 under SB 100. Even on today's grid, a BEB produces roughly 65–75% fewer lifecycle greenhouse gas emissions than a diesel bus per passenger-mile.
Will SF's electric bus investment lower my home EV charging costs?
Indirectly, yes. Transit depot electrification drives utility grid upgrades that increase local transformer capacity and may reduce interconnection costs for nearby residential Level 2 charger installations. It also supports PG&E's time-of-use rate structures that benefit all EV owners charging overnight.