The Short Answer on EV Registrations by State
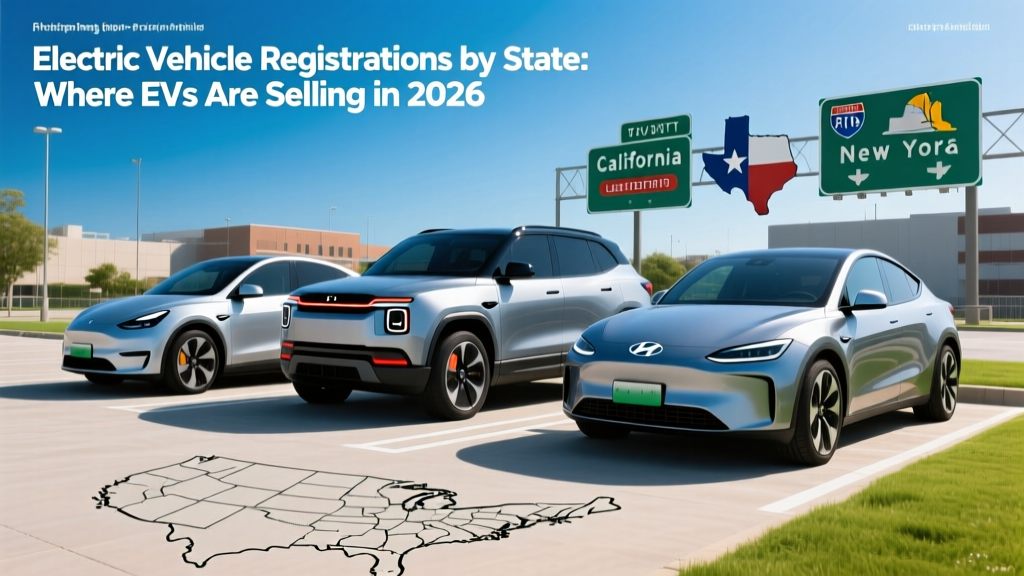
As of early 2026, California leads all 50 states with over 2.1 million cumulative electric vehicle registrations, followed by Florida (~420,000), Texas (~310,000), New York (~250,000), and Washington (~230,000). These five states account for roughly 55% of all EVs on U.S. roads. Nationally, cumulative EV registrations have surpassed 7.5 million battery-electric and plug-in hybrid vehicles, with BEVs representing approximately 78% of that total.
If you're researching electric vehicle registrations by state to decide whether an EV makes sense where you live, the key factors aren't just how many EVs your neighbors drive — they're your state's charging infrastructure density, climate, electricity rates, and available incentives. A state with high registrations typically signals strong dealer support, reliable public charging, and favorable economics. A state with low registrations doesn't mean you can't own an EV successfully; it just means you'll need to plan more carefully around home charging and route planning.
Top 15 States by Electric Vehicle Registrations (2026 Data)
Registration data drawn from state DMV reports, the U.S. Department of Energy's EV adoption tracking, and industry analysis by the Alliance for Automotive Innovation shows clear geographic concentration. States with zero-emission vehicle (ZEV) mandates, robust utility incentives, and dense charging networks dominate.
| Rank | State | Cumulative EV Registrations (est.) | EV Share of New Sales | ZEV Mandate State? |
|---|---|---|---|---|
| 1 | California | 2,140,000 | ~27% | Yes |
| 2 | Florida | 420,000 | ~11% | No |
| 3 | Texas | 310,000 | ~10% | No |
| 4 | New York | 252,000 | ~14% | Yes |
| 5 | Washington | 228,000 | ~18% | Yes |
| 6 | New Jersey | 185,000 | ~15% | Yes |
| 7 | Colorado | 162,000 | ~14% | Yes |
| 8 | Massachusetts | 148,000 | ~16% | Yes |
| 9 | Illinois | 131,000 | ~10% | No |
| 10 | Virginia | 124,000 | ~12% | Yes |
| 11 | Arizona | 118,000 | ~10% | No |
| 12 | Maryland | 112,000 | ~14% | Yes |
| 13 | Georgia | 105,000 | ~9% | No |
| 14 | Oregon | 98,000 | ~17% | Yes |
| 15 | North Carolina | 94,000 | ~9% | No |
Note: Cumulative figures include both BEVs and PHEVs registered through Q4 2025 / Q1 2026. EV share of new sales reflects trailing 12-month average. Sources: DOE Alternative Fuels Data Center, state DMV data, Auto Innovators.
Why Registration Numbers Matter for Your Purchase Decision
Electric vehicle registrations by state aren't just a popularity contest — they're a proxy for the ownership ecosystem you'll enter. Here's what high-registration states typically offer that low-registration states may lack:
Charging Infrastructure Density
California has over 110,000 public charging ports (Level 2 and DC fast combined), according to the Alternative Fuels Data Center. Wyoming, by contrast, has roughly 700. If you live in a low-registration state, you're more likely to encounter "charging deserts" — stretches of 80+ miles between DC fast chargers. This doesn't make EV ownership impossible, but it means home charging becomes non-negotiable, and road trips require more planning.
Dealer Network and Service Availability
States with high EV registrations have more dealerships stocking EV inventory, offering test drives, and employing EV-certified technicians. In low-adoption states, you may need to travel to a metro area for warranty service or order your vehicle with a 6-12 week wait.
State and Utility Incentives
Beyond the federal §30D tax credit (up to $7,500 for eligible new EVs, subject to MSRP caps, buyer income limits, and battery sourcing requirements per IRS rules), many high-registration states stack additional savings:
- California: Up to $7,000 via Clean Cars 4 All (income-dependent) + utility rebates up to $1,500 for home charger installation
- Colorado: $5,000 state tax credit (stackable with federal)
- Massachusetts: MOR-EV rebate up to $3,500
- New York: Drive Clean Rebate up to $2,000
These state incentives can lower the effective purchase price by $2,000–$12,000+ depending on your income and the vehicle. In states without additional incentives, the federal credit alone may still make EVs cost-competitive, but the margin narrows.
EV vs. Gas: Real Cost Comparison Across State Lines
The economics of EV ownership vary dramatically by state because electricity rates, gas prices, and incentive availability differ. Here's a concrete comparison using a mainstream vehicle segment — a mid-size SUV — comparing a 2026 Hyundai Ioniq 5 (BEV, 84 kWh usable battery, 311 miles EPA range) against a 2026 Toyota RAV4 AWD (gas, 30 MPG combined).
| Cost Factor | Hyundai Ioniq 5 SE (BEV) | Toyota RAV4 LE AWD (Gas) |
|---|---|---|
| Base MSRP | $42,600 | $31,200 |
| Federal Tax Credit (§30D) | Up to $7,500 (eligibility varies) | $0 |
| Effective Purchase Price | ~$35,100 (with full credit) | $31,200 |
| Energy Cost / 15,000 mi/yr (CA rates) | $548 (home charging, $0.28/kWh) | $2,150 ($4.30/gal, 30 MPG) |
| Energy Cost / 15,000 mi/yr (TX rates) | $326 (home charging, $0.14/kWh) | $1,600 ($3.20/gal, 30 MPG) |
| Annual Maintenance | ~$300 (tire rotation, cabin filter, wiper fluid) | ~$750 (oil changes, filters, brakes) |
| 5-Year Energy + Maintenance Total (CA) | ~$4,240 | ~$14,500 |
| 5-Year Energy + Maintenance Total (TX) | ~$3,130 | ~$11,750 |
The Ioniq 5's real-world energy savings over gas are substantial in every state, but they're most dramatic in high-gas-price states like California, Washington, and New York — which also happen to be the states with the highest EV registrations. In Texas, where gas is cheaper and electricity is also cheaper, the savings are smaller per mile but still meaningful over five years.
5-Year Total Cost of Ownership: State-by-State Snapshot
| State | EV 5-Year TCO* | Gas SUV 5-Year TCO* | EV Savings |
|---|---|---|---|
| California | $52,800 | $58,400 | $5,600 |
| Texas | $47,900 | $53,100 | $5,200 |
| New York | $51,200 | $56,800 | $5,600 |
| Florida | $49,100 | $53,900 | $4,800 |
| Ohio | $46,800 | $50,200 | $3,400 |
*TCO includes purchase price (after federal credit), energy, maintenance, and estimated insurance over 5 years / 75,000 miles. Excludes depreciation variance. Insurance for EVs averages 10-15% higher than gas equivalents.
Climate and Geography: The Hidden Variable Behind State Registration Gaps
Electric vehicle registrations by state don't just reflect policy — they reflect physics. Battery efficiency drops in cold weather, and range loss is the primary reason EV adoption lags in northern-tier and mountain states.
Cold-Weather Range Loss
In real-world winter testing at 20°F, most BEVs lose 25–35% of their EPA-rated range when cabin heating is active. A vehicle rated at 310 miles EPA may deliver 200–220 miles in Minnesota or Montana winters. This isn't a defect — it's thermodynamics. LFP (lithium iron phosphate) batteries tend to lose slightly more range in cold than NMC (nickel manganese cobalt) chemistries, though both are affected.
States where EV registrations are lowest — Wyoming, North Dakota, South Dakota, West Virginia, Mississippi — share common traits:
- Harsh winters (reducing range and increasing energy demand for heating)
- Low population density (fewer public chargers per square mile)
- Lower average gas prices (narrowing the EV economic advantage)
- No ZEV mandate or state-level incentives
Hot-Climate Considerations
Arizona and Nevada, despite extreme summer heat, show moderate-to-high EV registrations. Modern thermal management systems (liquid-cooled battery packs, heat pumps) handle heat better than cold. However, sustained 110°F+ temperatures accelerate long-term battery degradation. If you live in the desert Southwest, prioritize vehicles with robust thermal management (Tesla, Hyundai/Kia E-GMP, GM Ultium platforms all perform well in heat).
Home Charging Access: The Make-or-Break Factor
Registration data consistently shows that EV adoption correlates strongly with single-family home ownership. Approximately 80% of EV charging happens at home, on Level 2 (240V) equipment. If you can install a Level 2 charger in your garage or driveway, your EV experience will be fundamentally different from someone relying on public charging.
Level 2 Home Charging Cost Breakdown
| Item | Cost Range |
|---|---|
| Level 2 charger (40A, hardwired, e.g., ChargePoint Home Flex, Wallbox Pulsar Plus) | $350–$700 |
| Electrician labor (run 240V/50A circuit from panel) | $500–$2,500 |
| Electrical panel upgrade (if needed, 100A → 200A) | $1,500–$4,000 |
| Permit and inspection | $50–$300 |
| Total (typical, no panel upgrade) | $900–$3,500 |
| Total (with panel upgrade) | $2,400–$7,000 |
If you live in an apartment or condo without charging access, a PHEV (plug-in hybrid) may be a better bridge. PHEVs like the Toyota RAV4 Prime (42 miles electric-only, 38 MPG combined on gas) let you charge when convenient and burn gas when you can't. PHEV registrations are growing fastest in states with moderate EV infrastructure — a practical response to charging gaps.
Common EV Misconceptions vs. Reality
| Myth | Fact |
|---|---|
| "EVs don't work in cold states." | Norway leads the world in EV adoption per capita, with average winter temperatures well below freezing. Range drops 25-35%, but preconditioning and heat pumps mitigate this. Plan for 200 miles instead of 300 in deep cold. |
| "Batteries need replacing every few years." | Modern BEV batteries are warrantied for 8 years / 100,000 miles (10 years in CARB states). Real-world degradation data shows most packs retain 85-90% capacity at 100,000 miles. Full replacement costs $8,000–$18,000 but is rarely needed within the vehicle's useful life. |
| "The grid can't handle more EVs." | Most EVs charge overnight during off-peak hours when grid demand is low. A single EV charging at 7.2 kW (Level 2) uses roughly the same power as an electric clothes dryer. Utilities in high-EV-registration states have managed load growth through time-of-use rates. |
| "EVs are worse for the environment due to battery mining." | Lifecycle analyses from Argonne National Laboratory show BEVs produce fewer total emissions than gas cars over their lifetime in every U.S. grid region, even coal-heavy grids. The emissions "payback" period vs. manufacturing is typically 1.5–3 years of driving. |
| "There aren't enough chargers for road trips." | The U.S. now has over 200,000 public charging ports. Tesla's Supercharger network (opened to NACS-equipped non-Tesla vehicles) alone has 30,000+ fast chargers. Electrify America, EVgo, and others fill gaps. Planning apps like A Better Routeplanner make multi-state trips straightforward. |
Decision Framework: Should You Buy an EV Based on Your State?
Use this if-then framework to assess whether an EV fits your situation:
If you live in a top-10 EV registration state (CA, FL, TX, NY, WA, NJ, CO, MA, IL, VA):
- Charging infrastructure is likely sufficient for both daily driving and road trips.
- State incentives may stack with the federal §30D credit for significant savings.
- Dealers have EV inventory and certified service departments.
- Verdict: A BEV is a strong choice if you have home charging access.
If you live in a mid-tier state (NC, AZ, MD, GA, OR, MN, TN, PA, MI):
- Urban and suburban areas have adequate charging; rural areas may not.
- Check your utility for EV-specific time-of-use rates and charger rebates.
- Verdict: BEV works well with home charging. If you frequently drive 250+ mile rural routes, consider a PHEV or plan DC fast-charging stops.
If you live in a low-registration state (WV, MS, ND, SD, WY, MT, AR, LA, OK):
- Public DC fast charging may be sparse — verify routes using PlugShare or A Better Routeplanner before committing.
- Extreme cold or heat will impact range; choose a vehicle with a heat pump and robust thermal management.
- Home charging is essentially mandatory.
- Verdict: A PHEV may be the more practical choice if you lack guaranteed home Level 2 charging or regularly drive long rural distances. If you can charge at home and your daily commute is under 80 miles, a BEV still saves money.
If you can't install home charging anywhere:
- Public-only charging adds time (30-45 min for DC fast sessions) and cost ($0.30–$0.50/kWh at public chargers vs. $0.12–$0.28 at home).
- Verdict: A conventional hybrid (HEV) like the Toyota Camry Hybrid (51 MPG combined) may be a better fit until you gain charging access. HEVs need no plug and deliver meaningful fuel savings.
Federal Tax Credit: What Applies Regardless of Your State
The IRS §30D Clean Vehicle Credit offers up to $7,500 for eligible new EVs and up to $4,000 for eligible used EVs. However, eligibility depends on multiple factors that apply uniformly across all states:
- Buyer income caps: AGI must not exceed $150,000 (single), $225,000 (head of household), or $300,000 (married filing jointly)
- MSRP caps: Vans/SUVs/pickups up to $80,000; sedans up to $55,000
- Battery sourcing: Critical minerals and battery components must meet phased-in domestic/free-trade-agreement sourcing thresholds that tighten annually
- Point-of-sale transfer: As of 2024, you can transfer the credit to the dealer at purchase, reducing your out-of-pocket cost immediately rather than waiting for tax filing
Because battery sourcing requirements tighten each year, fewer models may qualify for the full $7,500 in 2026 than in prior years. Always verify current eligibility on the fueleconomy.gov tax credit tracker before purchasing.
Frequently Asked Questions
Which state has the highest percentage of EVs on the road?
California, by a wide margin. Roughly 1 in 4 new vehicles sold in California in 2025 was a plug-in electric vehicle (BEV or PHEV). Washington and Oregon follow at approximately 17-18% EV share of new sales.
Do low EV registration states have fewer charging stations?
Generally yes. States like Wyoming, North Dakota, and West Virginia have significantly fewer public charging ports per capita than high-registration states. However, the national NEVI (National Electric Vehicle Infrastructure) program is funding DC fast chargers along major highway corridors in all 50 states, which will gradually reduce these gaps through 2027.
Can I get the federal EV tax credit in any state?
Yes — the §30D credit is federal and applies equally in all 50 states. However, you must meet income, MSRP, and battery sourcing requirements. State-level incentives are separate and vary by jurisdiction. Consult a tax professional for your specific eligibility.
Are EV registrations growing or slowing in 2026?
Growing, but the rate has moderated from the 2021-2023 boom. Year-over-year EV sales growth in the U.S. is approximately 12-15% in 2025-2026, compared to 40-50%+ growth rates seen in the early 2020s. The market is maturing, and growth is increasingly driven by more affordable models (sub-$40,000 BEVs) and expanding PHEV options.
What if I live in a state with low EV registrations but want to go electric?
Focus on three things: (1) confirm you can install a Level 2 home charger, (2) map your most common driving routes against DC fast charger locations using PlugShare or the DOE's AFDC station locator, and (3) consider a PHEV if your routine includes long rural drives without reliable charging. Home charging access is the single biggest predictor of EV ownership satisfaction, regardless of state.