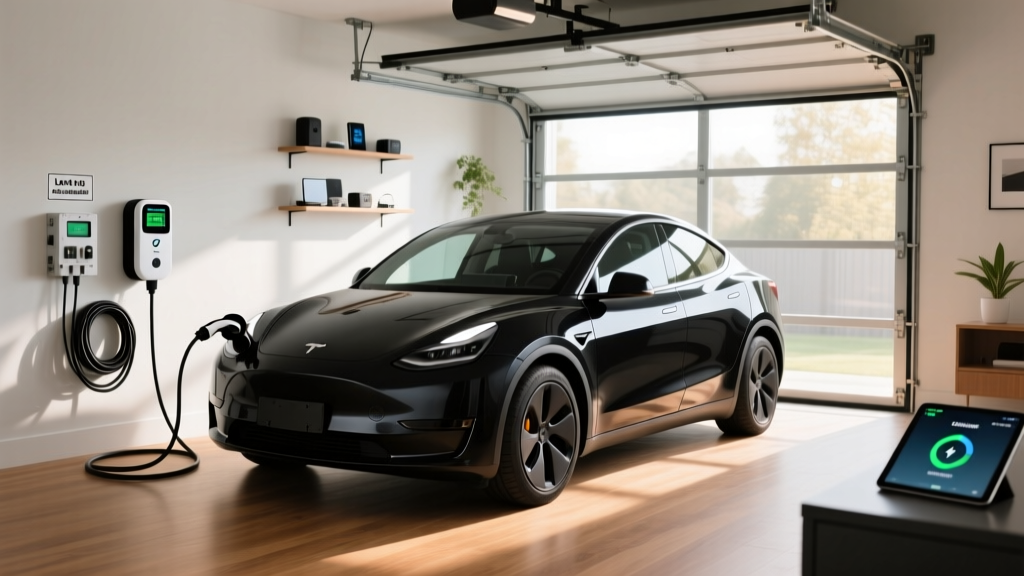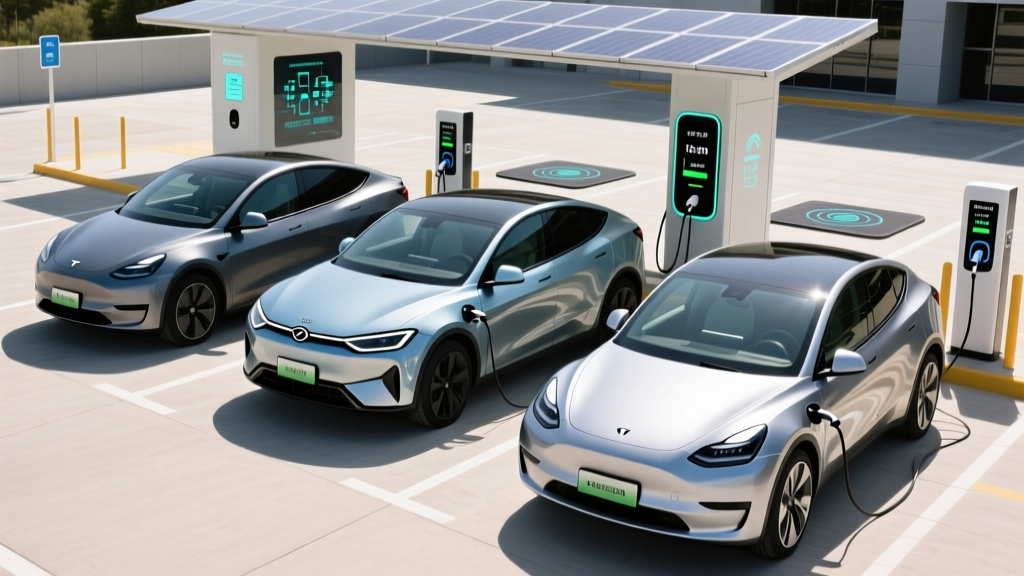
Transitioning a commercial fleet from internal combustion to battery-electric is no longer an experimental bet—it is a capital allocation decision governed by total cost of ownership (TCO), depot charging infrastructure, and federal tax incentives. Electric vehicle fleet management in 2026 requires balancing upfront vehicle premiums (typically 15–40% above gas equivalents) against dramatically lower per-mile energy and maintenance costs, while navigating depot electrical upgrades, route-range matching, and evolving IRS incentive rules under §30D (light-duty) and §45W (commercial clean vehicle). For most last-mile delivery, service, and municipal fleets averaging 60–150 miles per day with predictable return-to-base patterns, EVs now deliver a 3–5 year payback. Long-haul and rural fleets without depot charging access remain better served by hybrids or diesel until DC fast-charging corridors and battery energy density catch up.
Is an EV Fleet Right for Your Operation?
The first question every fleet manager must answer is whether their duty cycles align with current battery-electric capabilities. Not every route is a candidate, and forcing electrification onto incompatible routes is the fastest way to destroy ROI.
Quick Decision Check: If your vehicles return to a single depot nightly, drive under 180 miles per day (leaving a 20% buffer below EPA range for cold weather and HVAC load), and can install Level 2 or DC fast chargers on-site, you are a strong candidate for EV fleet management. If your routes exceed 250 miles daily, lack predictable endpoints, or operate in extreme cold (below 0°F) without garage parking, consider PHEVs or stay with ICE for now.
Route telematics data is your most valuable planning tool. Pull 90 days of GPS logs to identify maximum daily mileage, idle time, dwell locations, and ambient temperature ranges. Fleets using Geotab, Samsara, or Motive can run EV suitability reports that model range degradation against actual drive cycles—a critical step because EPA range stickers assume mixed driving at moderate temperatures, not stop-and-go urban delivery at 25°F.
2026 Commercial EV Options: Specs That Matter
The light- and medium-duty commercial EV market has matured significantly. Below are current-production models most relevant to fleet buyers, with the exact specifications that determine operational viability.
| Model | Body / Class | EPA Range | Battery (kWh, usable) | Chemistry | Peak DC Charge (kW) | 10–80% Time | Level 2 Rate (kW) | Base MSRP (2026) |
|---|---|---|---|---|---|---|---|---|
| Ford E-Transit (2026) | Cargo Van / Class 2 | 159 mi | 68 kWh | NMC | 115 kW | ~45 min | 11.5 kW (AC) | ~$48,000 |
| Chevrolet BrightDrop Zevo 600 | Step Van / Class 3 | 250 mi | 165 kWh | NMC | 150 kW | ~75 min | 19.2 kW (AC) | ~$95,000 |
| Lightning Electric Class 4 | Box Truck / Class 4 | 150 mi | 120 kWh | LFP | 120 kW | ~55 min | 19.2 kW (AC) | ~$140,000 |
| Tesla Model Y (fleet trim) | SUV / Class 1 | 310 mi | 75 kWh | LFP (RWD) | 250 kW | ~18 min | 11.5 kW (AC) | ~$44,990 |
| Rivian EDV (Amazon-spec, secondary market) | Step Van / Class 2 | 150 mi | 90 kWh | NMC | 150 kW | ~45 min | 11.5 kW (AC) | N/A (limited) |
Sources: fueleconomy.gov, manufacturer fleet spec sheets (2026 model year). Real-world range: expect 20–30% reduction in cold climates (below 32°F) and 10–15% reduction at sustained highway speeds above 70 mph. Urban stop-and-go routes with regenerative braking often match or slightly exceed EPA estimates.
Real-World Range Reality: The Ford E-Transit's 159-mile EPA rating assumes moderate conditions. In Minneapolis winter testing (15°F, HVAC on, urban delivery cycle), expect approximately 110–125 usable miles. In Phoenix summer (105°F, A/C maxed), expect ~140 miles. Plan routes to consume no more than 80% of rated range to preserve battery longevity and account for unexpected detours.
Total Cost of Ownership: EV Fleet vs. Gas Fleet
The purchase price of a commercial EV is higher, but the operating cost advantage is substantial—and it compounds over the vehicle's service life. The following table models a 5-year / 75,000-mile TCO for a light-duty cargo van in a mixed urban fleet, comparing the Ford E-Transit to the gasoline Ford Transit 250.
| Cost Category | Ford E-Transit (EV) | Ford Transit 250 (Gas) | Difference |
|---|---|---|---|
| Vehicle MSRP (base) | $48,000 | $42,500 | +$5,500 EV |
| Federal Tax Credit (§45W commercial) | −$7,500 | $0 | −$7,500 EV |
| Net Acquisition Cost | $40,500 | $42,500 | −$2,000 EV |
| Depot Charging Install (shared / 10 vans) | $3,200/van | $0 | +$3,200 EV |
| Energy / Fuel (75k mi @ $0.14/kWh vs $3.65/gal @ 16 MPG) | $3,150 | $17,109 | −$13,959 EV |
| Maintenance (oil, filters, brakes, trans.) | $1,800 | $5,400 | −$3,600 EV |
| Insurance (5 years, fleet policy) | $8,200 | $7,400 | +$800 EV |
| Estimated Residual Value (year 5) | $14,000 | $16,500 | −$2,500 EV |
| 5-Year Net TCO | $42,850 | $75,909 | −$33,059 EV |
| Cost Per Mile | $0.57 | $1.01 | −$0.44/mi EV |
Key assumptions: commercial electricity rate of $0.14/kWh (national average for depot charging per EIA 2025 data); gasoline at $3.65/gal; 15,000 miles/year. The EV's energy cost advantage alone recovers the upfront premium within 18 months for a van driven 15,000 miles annually. Maintenance savings—no oil changes, no transmission fluid, 60–80% less brake wear due to regenerative braking—add $720/year. Insurance remains 8–12% higher for EVs due to repair cost structures and parts pricing, though this gap has narrowed as collision repair networks gain EV certification.
Depot Charging Infrastructure: What It Actually Costs
The single biggest implementation barrier in electric vehicle fleet management is not the vehicles—it is the electrical infrastructure. Most commercial depots were not built with the electrical capacity to charge 10–50 vehicles simultaneously overnight.
| Component | Per-Charger Cost Range | Notes |
|---|---|---|
| Level 2 Charger (19.2 kW, hardwired) | $1,500–$3,500 | ChargePoint, Blink, or BTC Power commercial units |
| Electrical Panel Upgrade (if needed) | $5,000–$25,000 | 400A service upgrade for 10+ chargers; utility transformer may be required |
| Trenching & Conduit (per run) | $1,500–$4,000 | Depends on distance from panel to parking stalls |
| Electrician Labor (licensed, commercial) | $3,000–$8,000 | Varies by region; prevailing wage requirements for public fleets |
| Permitting & Utility Interconnection | $1,000–$5,000 | Utility demand-charge review may add 3–6 months |
| Networked Fleet Software (annual) | $200–$400/charger | Charge scheduling, load management, telematics integration |
| Total per Charger (typical depot) | $8,000–$18,000 | Amortized across fleet; utility rebates may offset 30–50% |
For a 20-van depot, expect a total infrastructure investment of $120,000–$300,000 before utility rebates. The critical step is engaging your utility's commercial EV program early—many investor-owned utilities (PG&E, ConEdison, Xcel Energy) offer make-ready programs that cover the utility-side infrastructure (transformer, service drop, meter) at no cost to the fleet operator. Federal §30C alternative fuel refueling property credit covers up to 30% of charging equipment and installation costs (capped at $100,000 per item), subject to prevailing wage and census-tract eligibility requirements.
Federal Tax Incentives: §30D, §45W, and §30C Explained
Fleet buyers have access to three distinct federal incentive programs, each with specific eligibility rules that change annually. Misunderstanding these is the most common financial mistake in EV fleet procurement.
- §30D Clean Vehicle Credit (light-duty, <8,500 lb GVWR): Up to $7,500 per vehicle. Subject to MSRP caps ($55,000 sedans, $80,000 vans/SUVs/trucks), buyer income limits, and critical mineral + battery component sourcing requirements. Available as a point-of-sale transfer to the dealer. For fleet purchases, the vehicle must be titled to the business and used primarily in the U.S. Verify current-year sourcing compliance at IRS qualified vehicle list.
- §45W Commercial Clean Vehicle Credit: For vehicles over 8,500 lb GVWR or those not qualifying under §30D. Credit equals the lesser of 15% of vehicle basis (30% if no gas/diesel use) or the incremental cost over a comparable ICE vehicle, up to $7,500 (light) or $40,000 (heavy). No MSRP or income caps. Requires business use and U.S. registration. Cannot be stacked with §30D on the same vehicle.
- §30C Alternative Fuel Refueling Property Credit: 30% of charging equipment + installation costs, up to $100,000 per single item of property. Must be placed in service in a qualifying census tract (low-income or non-urban). Prevailing wage and apprenticeship requirements apply for full credit amount.
Consult a tax professional before finalizing procurement. Credit stacking rules, depreciation schedules (bonus depreciation under §168 applies to EVs), and state-level incentives (California HVIP, New York Truck Voucher Incentive) can reduce net acquisition cost by 25–45%.
Common Fleet EV Misconceptions vs. Reality
| Myth | Fact (with data) |
|---|---|
| "EV batteries won't last the life of the fleet vehicle." | Most commercial EVs carry 8-year/100,000-mile battery warranties guaranteeing ≥70% capacity retention (Ford, GM, Rivian). LFP-chemistry packs (Lightning Electric, Tesla RWD) demonstrate <10% degradation at 200,000 miles in fleet telematics data. Plan for 80% SoH at year 8 and route accordingly. |
| "Charging takes too long for fleet operations." | Depot Level 2 charging (19.2 kW) adds ~50 miles/hour—more than enough for overnight replenishment of a 120-mile route. DC fast charging at 115–150 kW restores 10–80% in 45–75 minutes, suitable for mid-shift top-ups on longer routes. Opportunity charging during driver lunch breaks recovers 40–60 miles in 20 minutes. |
| "EVs can't handle cold weather." | Range loss of 20–30% is real at 15°F, but modern thermal management (heat pumps in the E-Transit and BrightDrop) reduces HVAC energy draw by 30–40% vs. resistive heaters. Preconditioning while plugged in preserves range. Cold-climate fleets spec 25–30% more battery than their route requires. |
| "The grid can't handle a fleet of EVs charging." | Managed charging software (e.g., ChargePoint Fleet, EV Connect) staggers charge sessions across off-peak hours (10 PM–6 AM), keeping depot demand within existing transformer capacity. A 20-van fleet charging at 7.7 kW each draws 154 kW—equivalent to a small office building, manageable with utility coordination. |
| "Resale value is terrible." | Commercial EV residuals are stabilizing as the used fleet market matures. 3-year residual values for the E-Transit now track at 38–42% (vs. 45–50% for gas Transit), narrowing as fleet buyers gain confidence in battery health reports. |
Operational Considerations: What First-Time Fleet EV Buyers Must Know
Beyond the spreadsheet, several operational realities determine whether an EV fleet deployment succeeds or stalls:
Driver training is non-negotiable. Regenerative braking behavior, one-pedal driving modes, and preconditioning workflows require a 2–4 hour onboarding session. Fleets that skip training see 15–20% higher energy consumption and more brake-related service calls as drivers ride the friction brakes instead of using regen.
Telematics integration must be EV-aware. Standard OBD-II fleet trackers do not capture State of Charge (SoC), battery temperature, or charge-session data natively. Specify telematics platforms (Geotab EV, Samsara EV) that integrate with the vehicle's CAN bus to report real-time SoC, charge completion alerts, and kWh/mi efficiency per driver.
Charger-to-vehicle ratio planning: For overnight depot charging of vehicles with <150-mile daily routes, a 1:2 ratio (one Level 2 charger per two vehicles) is sufficient if charge management software rotates sessions. For high-utilization routes (>180 miles), plan 1:1 or supplement with DC fast chargers at 1 per 5–8 vehicles.
Utility demand charges can destroy economics if unmanaged. Commercial electricity bills include demand charges ($8–$20/kW of peak draw per month) that can exceed energy charges. Managed charging that flattens the demand curve is essential—unmanaged simultaneous charging of 20 vehicles could trigger $3,000–$6,000/month in demand charges alone.
Decision Framework: Should You Electrify Your Fleet?
Electrify now if:
- Daily routes are under 150 miles with return-to-base overnight
- Depot has (or can upgrade to) 200A+ electrical service
- Fleet operates in a state with utility make-ready programs or HVIP-style vouchers
- Vehicles are due for replacement within 12–18 months
- TCO analysis shows payback under 4 years at current mileage
Wait or choose PHEV/hybrid if:
- Daily routes regularly exceed 200 miles without mid-shift charging access
- Depot is leased with <5 years remaining and landlord unwilling to approve infrastructure
- Fleet operates in extreme cold (<0°F sustained) without indoor parking
- Utility interconnection timeline exceeds 18 months
- Vehicle duty cycle requires towing >5,000 lbs over long distances
Phase approach for mixed fleets: Electrify the 30–50% of vehicles with the shortest, most predictable routes first. Use telematics data from Phase 1 to validate range and charging assumptions before expanding. This de-risks the infrastructure investment and builds organizational EV competency.
Frequently Asked Questions
Can my fleet vehicles charge at public DC fast chargers instead of a depot?
Technically yes, but it is economically inefficient. Public DC fast charging costs $0.35–$0.55/kWh (versus $0.10–$0.18/kWh for depot Level 2), adding $0.05–$0.12/mile in energy cost. It also accelerates battery degradation—daily DCFC use above 80% SoC can reduce battery life by 15–25% over 5 years. Use public DCFC only as a supplement for unexpected route extensions or mid-day top-ups, not as a primary strategy.
How do I handle EV fleet charging in a multi-tenant commercial building?
Shared commercial properties require landlord consent, electrical sub-metering for utility billing, and often a dedicated transformer. Work with a commercial EV infrastructure provider (ChargePoint, EVgo Commercial, Blink) that offers hosted solutions where they own and maintain the chargers and bill your fleet directly per kWh, eliminating capital outlay. Expect a 4–8 month timeline from lease negotiation to energization.
What happens if an EV's battery degrades below usable capacity?
Under the standard 8-year/100,000-mile warranty, the manufacturer must replace or repair the battery if capacity falls below 70% of original. For fleet vehicles exceeding warranty mileage, third-party battery refurbishment services (e.g., Redwood Materials, Cirba Solutions) now offer pack-level cell replacement at $5,000–$12,000 per vehicle—substantially less than full OEM pack replacement ($15,000–$30,000). Factor a battery reserve fund of $200/vehicle/month starting in year 6.
Do electric fleet vehicles qualify for the §30D $7,500 tax credit?
It depends on the vehicle class. Light-duty fleet vehicles under 8,500 lb GVWR (e.g., Tesla Model Y, Ford E-Transit at certain configurations) may qualify under §30D, subject to MSRP caps, buyer income limits, and battery sourcing rules. Heavier commercial vehicles fall under §45W, which has no income or MSRP cap but calculates credit differently. Always verify the specific vehicle on the IRS qualified vehicles list before purchase, as eligibility changes monthly based on supply-chain sourcing updates.
How does EV fleet management software differ from standard fleet telematics?
EV-specific fleet management platforms add charge-session monitoring, SoC-based dispatch (only assign vehicles with sufficient charge for the route), energy-cost optimization (shift charging to off-peak utility rates), battery health trend reporting, and integration with depot charger load management. Standard telematics platforms track location, speed, and fuel level—but fuel-level logic does not translate to SoC-based range prediction with temperature and payload adjustments.