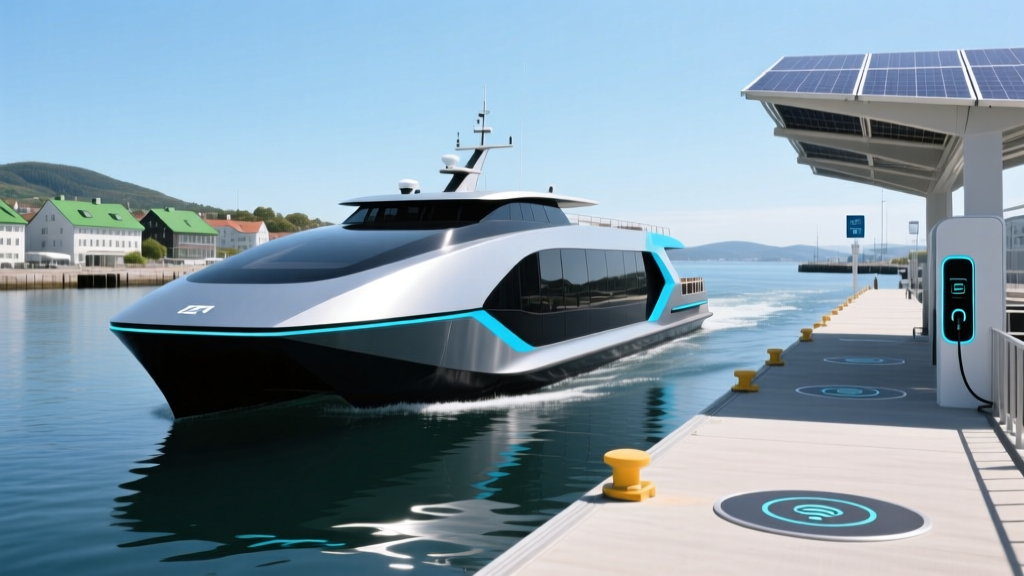
Quick Answer: Electric ferries are battery-electric vessels that replace diesel engines with large lithium-ion battery packs (typically 1,000–8,000 kWh) and electric motors, charged at dock-side stations between crossings. As of 2026, over 80 fully electric car and passenger ferries operate worldwide, with the largest carrying 300+ passengers and 120+ vehicles on routes up to 25 nautical miles. They eliminate fuel costs (saving operators $500,000–$2M annually on busy routes), cut emissions dramatically, and reduce noise and vibration — but require significant dock-side charging infrastructure and are limited by route length and battery weight.
If you've searched "electric ferry" and landed on an EV site, you're likely curious about how maritime electrification connects to the broader electric vehicle ecosystem. Electric ferries represent the waterborne branch of battery-electric transportation — using the same core lithium-ion chemistry, charging principles, and kW/kWh relationships that power your electric car, just at a vastly different scale. This guide breaks down the technology, economics, and real-world deployment of electric ferries from an EV-literate perspective.
How Electric Ferries Work: Battery Chemistry and Powertrain Basics
At the most fundamental level, an electric ferry swaps a diesel engine for an electric drivetrain. The architecture mirrors a road-going EV, scaled up by orders of magnitude:
- Battery pack: Typically 1,000–8,000 kWh of usable capacity (for context, a Tesla Model Y Long Range carries ~75 kWh). Most current electric ferries use NMC (nickel manganese cobalt) lithium-ion cells for their higher energy density — a critical factor when battery mass directly affects vessel displacement and payload.
- Electric motors: Permanent-magnet synchronous motors, often two or more, delivering 1,000–5,000 kW combined propulsion power. Instant torque delivery eliminates the lag inherent in diesel spin-up.
- Thermal management: Liquid-cooled battery systems, similar to those in premium EVs, maintain cell temperatures between 15–35°C for longevity and safety.
- Charging system: Shore-side DC fast charging at 600 kW to 3 MW (megawatts), often via automated robotic arms that connect as the vessel docks — no human plug-in required.
The kW vs kWh distinction that trips up new EV buyers applies identically here: a ferry might carry 4,000 kWh of battery energy and charge at a 2.4 MW (2,400 kW) rate, meaning a 10–80% top-up could take roughly 70–90 minutes depending on the charge curve taper. Some ultra-short-route ferries use flash-charging: a 600–900 kW burst during a 5–10 minute passenger loading window, adding enough energy for the next crossing.
Electric Ferry vs Diesel: Cost and Efficiency Comparison
The economic case for electric ferries follows the same logic as EV vs gas car ownership — higher upfront capital, dramatically lower operating costs. Here's how the numbers stack up for a typical 50-car, 300-passenger commuter ferry on a 5-nautical-mile route:
| Metric | Diesel Ferry | Electric Ferry |
|---|---|---|
| Vessel purchase cost | $12–18 million | $18–28 million |
| Annual fuel/energy cost | $800K–$1.5M (marine diesel) | $150K–$400K (electricity) |
| Annual maintenance | $300K–$500K | $100K–$200K |
| Engine/motor overhaul interval | 15,000–20,000 hours | 40,000+ hours (no combustion wear) |
| Battery replacement (if needed) | N/A | $2–5M at ~10–15 years |
| Dock-side charging infrastructure | None required | $2–8 million (transformers, cabling, chargers) |
| CO₂ per crossing (avg grid mix) | ~1,200–2,000 kg | ~100–400 kg (varies by grid) |
| Noise at dock (dB) | 75–85 dB | 50–60 dB |
The EPA's analysis of electric transportation confirms that even on fossil-heavy grids, electrified transit reduces lifecycle emissions. For ferry operators running 8–12 round trips daily, 365 days a year, the fuel savings alone can pay back the cost premium in 5–8 years.
Real-World Electric Ferries Operating Today
This isn't future-tech speculation. Several notable electric ferries are in active service as of 2026:
- MF Ampere (Norway): The world's first fully electric car ferry, launched in 2015 by Norled. Carries 120 cars and 360 passengers across a 5.7 km fjord route. Uses a 1,000 kWh NMC battery, charges at 800 kW during 10-minute dock stops. Over a decade of operation has proven the model.
- Ellen (Denmark): Connects the islands of Ærø and Fyns. 4.3 MWh battery capacity (one of the largest at launch), serving a 22-nautical-mile route — demonstrating that longer crossings are feasible with sufficient battery mass.
- Washington State Ferries (USA): The largest US ferry system is converting its Jumbo Mark II class to hybrid-electric and building new fully electric Olympic-class vessels, with 8+ MWh battery packs. The project has faced delays and budget overruns — a real-world lesson in maritime electrification complexity.
- China's Yangtze River ferries: Several 1,000+ passenger electric river ferries operate with CATL-supplied LFP batteries, chosen for their superior cycle life and thermal stability over NMC — the same chemistry trade-off debated by EV buyers.
Battery Chemistry Trade-Offs: LFP vs NMC on the Water
The battery chemistry decision for electric ferries mirrors the exact trade-offs EV owners evaluate. Here's how the two dominant chemistries perform in maritime applications:
| Factor | NMC (Nickel Manganese Cobalt) | LFP (Lithium Iron Phosphate) |
|---|---|---|
| Energy density | Higher (150–220 Wh/kg) — less weight for same capacity | Lower (120–170 Wh/kg) — heavier pack for same range |
| Cycle life | 2,000–4,000 cycles to 80% SoH | 4,000–8,000+ cycles to 80% SoH |
| Thermal stability | Moderate — requires robust BMS | Excellent — far lower thermal runaway risk |
| Cost per kWh (2026) | $110–$140 | $75–$100 |
| Best for | Longer routes where weight matters | Short, high-frequency routes with many cycles/day |
For a ferry making 16 crossings a day, 365 days a year, cycle life is paramount. That 5,840 annual cycles will exhaust most NMC packs in 4–7 years, while LFP can last 10–15 years in the same duty cycle. Weight matters less on water than on road (buoyancy helps), which is why LFP is gaining maritime market share faster than in passenger cars.
Charging Infrastructure: The Dock-Side Challenge
This is where electric ferries face a challenge that mirrors the EV world's charging-desert problem. A 3 MW shore-side charger isn't a simple plug installation:
- Grid connection: Most ferry terminals need dedicated medium-voltage (12–35 kV) utility feeds, requiring transformer upgrades costing $1–4 million alone.
- Automated coupling: Unlike plugging in a car, ferry chargers use robotic pantograph or cable-management arms that connect in under 30 seconds as the vessel berths — necessary for the tight turnaround schedules of commuter routes.
- Port space: Charger cabinets, switchgear, and cooling systems require significant dock real estate, which is often constrained in urban harbors.
- Grid demand charges: Utilities bill commercial customers for peak demand (kW), not just energy (kWh). A 3 MW ferry charger can trigger $50,000–$100,000+ in monthly demand charges unless mitigated with on-site battery buffer storage — the same principle as a home Powerwall buffering solar.
These infrastructure costs are the maritime equivalent of the EV buyer discovering their home needs a $3,000–$8,000 panel upgrade before installing a Level 2 charger. They're real, they're significant, and they're the primary barrier to adoption.
Common Misconceptions About Electric Ferries
Myth: "Electric ferries can't handle rough seas or long routes."
Fact: Route length is the real constraint, not sea state. Current battery technology limits fully electric ferries to roughly 20–30 nautical miles before battery mass becomes impractical. For longer routes, hybrid-electric (diesel generator + battery) is the current solution — directly analogous to PHEVs bridging range gaps for road vehicles.
Myth: "They're just niche prototypes."
Fact: Norway alone operates over 70 fully electric ferries as of 2026. China has deployed dozens more on rivers and coastal routes. The technology is proven at scale in favorable regulatory environments.
Myth: "Battery replacement makes them uneconomical."
Fact: Battery replacement at 10–15 years costs $2–5M, but over that period a busy ferry saves $5–15M in fuel and maintenance. The net present value is strongly positive on high-utilization routes.
Myth: "They're zero-emission everywhere."
Fact: Like road EVs, electric ferries' upstream emissions depend on grid mix. On a coal-heavy grid, emissions shift from the tailpipe (or smokestack) to the power plant. On grids with high renewable penetration — like Norway's 98% hydro — the reduction is near-total.
Decision Framework: When Does an Electric Ferry Make Sense?
Choose a fully electric ferry if:
- Route is under 20 nautical miles (one-way)
- Crossing frequency is 8+ round trips per day (high utilization justifies capital cost)
- Dock time is 10+ minutes (enough for flash-charging or partial top-up)
- Local grid has renewable-heavy mix or low electricity rates
- Regulatory mandates or subsidies support electrification (common in Scandinavia, growing in US Pacific Northwest)
- Noise and air pollution at dock are community concerns
Choose hybrid-electric (diesel + battery) if:
- Route exceeds 25–30 nautical miles
- Dock time is under 5 minutes (insufficient for meaningful charging)
- Grid infrastructure cannot support multi-megawatt charging
- Operational profile includes occasional long diversion routes
Stick with diesel (for now) if:
- Route is 50+ nautical miles open-ocean
- Annual crossings are low (under 1,000/year — fuel savings won't offset capital premium)
- No shore-power infrastructure exists and grid upgrades are cost-prohibitive
Frequently Asked Questions
How far can an electric ferry travel on a single charge?
Current production electric ferries cover 10–30 nautical miles on a full charge, depending on battery capacity (1,000–8,000 kWh), vessel size, speed, and sea conditions. The 22-nautical-mile Ellen ferry in Denmark represents the practical upper bound for fully electric service as of 2026. Beyond that, hybrid-electric or conventional diesel remains necessary.
How long does it take to charge an electric ferry?
With 1–3 MW shore chargers, a 10–80% charge takes 40–90 minutes for large battery packs (3,000–5,000 kWh). However, most commuter ferries use flash-charging: a 600–900 kW burst during 5–10 minute passenger loading, adding 100–250 kWh per stop — enough for the next short crossing. This mirrors how road EVs use DC fast charging on trips versus overnight Level 2 at home.
Do electric ferries qualify for government incentives?
Not under the IRS §30D federal EV tax credit — that applies to road vehicles only. However, the US Maritime Administration and state agencies (notably Washington State and New York) offer grants and low-interest financing for ferry electrification. The EPA's Clean Ports Program and Diesel Emissions Reduction Act (DERA) grants have funded several US electric ferry projects. Check your state energy office for local maritime electrification incentives.
What happens if an electric ferry runs out of charge mid-crossing?
Maritime regulations require reserve capacity — typically 20–30% battery buffer beyond the planned route energy. Vessel energy management systems continuously monitor State of Charge (SoC) and will reduce speed to conserve energy if needed. Some operators also carry a small backup diesel generator. This is the maritime equivalent of an EV's range buffer and low-SoC limp mode.
How does this connect to EV ownership?
Electric ferries and road EVs share the same foundational technology: lithium-ion batteries, electric motors, DC fast charging, and the kW/kWh relationship. If you understand your EV's charge curve, battery degradation, and infrastructure needs, you already understand the core engineering behind electric ferries — just scaled up 50–100×. The same LFP vs NMC debates, the same charging infrastructure challenges, and the same total-cost-of-ownership math apply.