The Electric Bus Market in 60 Seconds
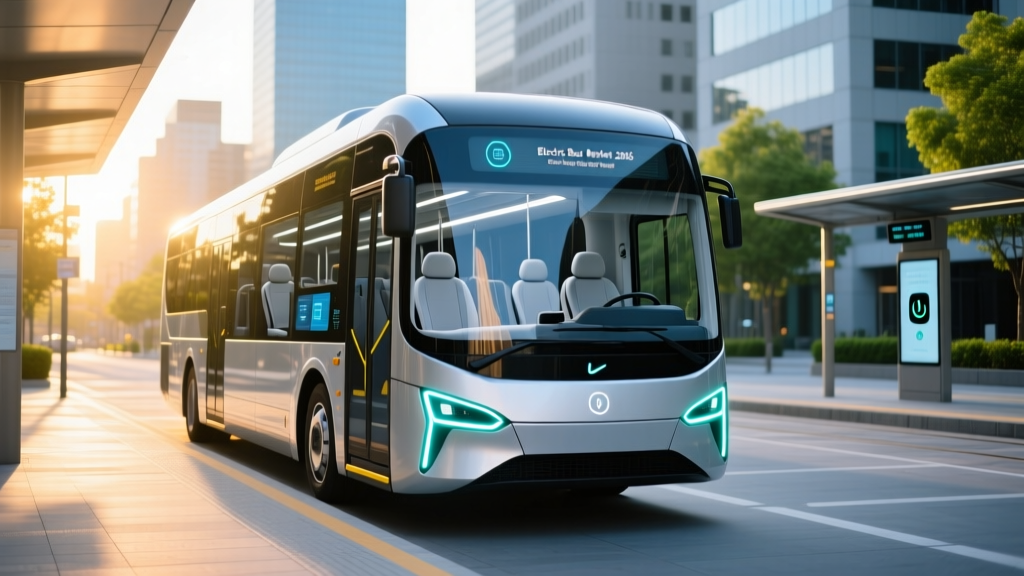
The U.S. electric bus market in 2026 is dominated by heavy-duty transit and school bus applications, with battery-electric buses (BEBs) offering 150–250 miles of real-world range on battery packs ranging from 350 to 660 kWh. Upfront costs run $900,000–$1.4 million per unit before federal and state incentives — roughly 2–3× the price of a comparable diesel bus. However, per-mile energy costs are 60–70% lower than diesel, and lifetime maintenance savings of $150,000–$400,000 per vehicle narrow the gap over a 12-year service life. The core decision for fleet managers is whether daily route distances fall under 200 miles with depot charging access — if so, electrification pencils out; if not, hybrid or CNG alternatives remain practical.
Who Is Actually Buying Electric Buses — and Why
The electric bus market splits into three primary buyer segments, each with different economic drivers:
- Transit agencies (municipal and regional): Mandated by state zero-emission fleet rules in California, New York, New Jersey, and Washington. These buyers prioritize range reliability, depot charging infrastructure, and ADA-compliant low-floor designs.
- School districts: Driven by EPA Clean School Bus Program funding (up to $375,000 per BEB in qualifying districts) and community pressure for cleaner air around children. Route predictability makes school buses ideal BEB candidates.
- Private shuttle/charter operators: Airport shuttles, university transit, and corporate campuses adopt BEBs where short, fixed loops and overnight depot charging align with operations.
According to the Federal Transit Administration, over 5,000 battery-electric transit buses were in active U.S. revenue service by late 2025, with orders pushing that figure past 7,000 in 2026. The school bus segment is growing faster by percentage, with manufacturers like Blue Bird, IC Bus, and Thomas Built delivering thousands of BEB school buses annually.
Real-World Range, Battery Specs, and What the Sticker Doesn't Tell You
Electric bus range claims from manufacturers typically cite ideal conditions: flat terrain, 65°F ambient, no passenger load, minimal HVAC use. Real-world operations tell a different story.
| Specification | Transit Bus (40-ft) | School Bus (Type C) | Diesel Transit Bus (40-ft) |
|---|---|---|---|
| Usable Battery Capacity | 440–660 kWh (NMC/NCA) | 155–226 kWh (NMC/LFP) | N/A (diesel tank ~80 gal) |
| Manufacturer-Claimed Range | 220–290 mi | 120–150 mi | 400–500 mi |
| Real-World Range (loaded, HVAC) | 150–210 mi | 75–120 mi | 350–450 mi |
| Cold-Weather Range Loss (20°F) | 25–40% | 25–40% | 5–10% |
| Peak DC Charge Rate | 150–350 kW (CCS/NACS) | 60–150 kW (CCS) | N/A |
| 10–80% Charge Time (Depot) | 2.5–4.5 hours | 2–4 hours | 15 min (refuel) |
| Energy Consumption | 2.0–3.5 kWh/mi | 1.8–2.8 kWh/mi | 4.5–6.0 mi/gal diesel |
| Base MSRP (2026) | $900,000–$1,400,000 | $300,000–$420,000 | $500,000–$650,000 |
| Battery Warranty | 8–12 yr / capacity ≥70% | 5–10 yr / capacity ≥70% | N/A |
The single biggest range variable in the electric bus market is HVAC load. Heating a 40-foot transit cabin in January in Chicago can draw 30–50 kW continuously — that's energy that would otherwise go to propulsion. Agencies in cold climates increasingly specify battery-electric buses with heat pump systems rather than resistive electric heaters, cutting HVAC energy draw by roughly 40–50%. Even so, a route that uses 180 miles of range in July may consume 240 miles of equivalent range in February.
Depot charging at 150 kW (Level 2 DC) remains standard for overnight top-ups. However, opportunity charging via pantograph or high-power CCS at 350 kW along routes is growing in cities where mid-day range extension is necessary. The trade-off: opportunity chargers cost $250,000–$500,000 per station installed, versus $40,000–$120,000 per depot plug.
Total Cost of Ownership: Where Electric Buses Win (and Where They Don't)
Upfront capital cost is the headline barrier. A 40-foot battery-electric transit bus costs roughly $1.1 million before incentives, compared to $550,000 for a clean-diesel equivalent. But fleet economics require a lifecycle view.
| Cost Category | Battery-Electric Bus | Diesel Bus | CNG Bus |
|---|---|---|---|
| Vehicle Purchase | $1,100,000 | $550,000 | $620,000 |
| Federal/State Incentives | –$250,000 to –$450,000 | $0 | –$50,000 to –$100,000 |
| Charging/Fueling Infrastructure (amortized) | $80,000–$150,000 | $0 (existing depot) | $60,000–$100,000 |
| Energy/Fuel (12 years) | $180,000–$260,000 | $580,000–$720,000 | $420,000–$540,000 |
| Maintenance (12 years) | $120,000–$180,000 | $350,000–$450,000 | $300,000–$400,000 |
| Mid-Life Battery Replacement (yr 7–8) | $80,000–$160,000 | $0 | $0 |
| Net 12-Year Cost | $1,230,000–$1,540,000 | $1,480,000–$1,720,000 | $1,330,000–$1,660,000 |
The numbers show BEBs achieving cost parity or a slight advantage over 12 years, but only when incentives are captured and routes stay within range limits. The mid-life battery replacement — typically needed around year 7–9 when capacity drops below 80% — remains a significant cost event that diesel budgets never face. Some agencies mitigate this through battery leasing programs offered by manufacturers like Proterra (now part of a restructured entity) and BYD's U.S. operations.
Maintenance savings are where BEBs shine most clearly. No engine oil, no diesel particulate filters, no exhaust gas recirculation valves, no transmission fluid changes. Brake wear drops 50–70% thanks to regenerative braking handling most deceleration. Transit agencies consistently report 30–50% lower maintenance cost per mile for BEBs versus diesel.
Charging Infrastructure: The Hidden Bottleneck in the Electric Bus Market
The bus itself is only half the purchase decision. Depot charging infrastructure often adds 15–30% to total project cost and introduces a 12–24 month lead time for utility upgrades.
Consider a 20-bus fleet conversion. Each bus drawing 150 kW simultaneously during overnight charging requires 3 MW of electrical capacity — equivalent to powering roughly 2,000 homes. Most existing bus depots have 400–800 kVA of service. A utility upgrade to 3–5 MW can cost $500,000–$2 million and take 18 months for transformer procurement and installation.
Smart charge management software (from providers like ChargePoint, Heliox, and ABB) mitigates this by staggering charge sessions and prioritizing buses with earlier departure times. With managed charging, a 20-bus depot might operate on 1.5–2 MW rather than 3 MW, cutting upgrade costs substantially.
Key infrastructure cost components:
- DC fast charger hardware (150 kW CCS): $50,000–$90,000 per unit
- Electrical switchgear and conduit: $15,000–$40,000 per stall
- Utility service upgrade: $200,000–$1,500,000 depending on capacity gap
- Charge management software: $5,000–$15,000 annual license per site
- Permitting and engineering: $30,000–$80,000 per depot
Electric Bus Market Misconceptions — Addressed with Data
| Myth | Fact |
|---|---|
| "Electric buses can't handle cold weather" | Range drops 25–40% in sub-freezing temps, but agencies in Duluth, MN, and Winnipeg operate BEBs year-round by oversizing batteries 30% and using heat pumps. Route planning adjusts seasonally. |
| "Battery replacement makes BEBs more expensive long-term" | A mid-life pack replacement costs $80,000–$160,000, but fuel and maintenance savings over 12 years typically exceed $400,000. Net economics still favor BEB in most scenarios with incentives. |
| "Electric buses break down more than diesel" | Early-model BEBs (2018–2020) had teething issues. Current-generation platforms from New Flyer, BYD, and Gillig report mean distance between failures (MDBF) equal to or exceeding diesel, per FTA National Transit Database data. |
| "The grid can't support fleet electrification" | Most depot charging happens overnight during off-peak hours when grid capacity is underutilized. Managed charging and utility demand-response programs further reduce strain. The bottleneck is local transformer capacity, not generation. |
| "Hydrogen fuel cell buses are a better zero-emission option" | FCEBs offer longer range (300+ mi) and faster refueling (15 min), but hydrogen costs $12–$25/kg in most markets — equivalent to $8–$15/gallon diesel on a per-mile basis. BEBs remain 2–3× cheaper to fuel per mile in 2026. |
Decision Framework: Should Your Fleet Go Electric?
If-Then Guide for Fleet Electrification
- If your longest daily route is under 150 miles AND you have depot property for overnight charging: Battery-electric buses are a strong fit. Proceed with a pilot of 2–5 units to validate range in your climate, then scale. Prioritize models with heat pump HVAC and CCS charging compatibility.
- If routes regularly exceed 200 miles OR you operate in extreme cold without heated depots: Consider a mixed fleet — BEBs for shorter routes, CNG or renewable diesel for longer/express runs. Avoid committing 100% to BEB until battery energy density improves or opportunity charging infrastructure is funded.
- If you're a school district with routes under 100 miles round-trip: BEBs are the sweet spot. Apply for EPA Clean School Bus Program funding and state incentive programs. The predictable, twice-daily route pattern with 8-hour mid-day parking is ideal for depot charging.
- If utility upgrade quotes exceed $1 million for your depot: Phase your BEB adoption over 3–5 years, aligning vehicle orders with infrastructure buildout. Explore utility make-ready programs — many investor-owned utilities cover 50–100% of infrastructure costs on the utility side of the meter.
- If your fleet is under 10 buses and you lack dedicated depot land: Public or shared charging infrastructure for heavy-duty BEBs remains limited in most markets. A plug-in hybrid or CNG conversion may be more practical until commercial HD charging corridors mature.
Key Players in the 2026 Electric Bus Market
The competitive landscape has consolidated somewhat since the early 2020s shakeout:
- New Flyer Xcelsior CHARGE NG (NFI Group): Dominant in North American transit. 40-ft and 60-ft articulated models with up to 525 kWh of NMC battery. Peak charge rate of 350 kW via CCS. List price ~$1.2M for 40-ft.
- BYD (Build Your Dreams): Major global player with U.S. manufacturing in Lancaster, CA (though Buy America compliance has been contested). LFP battery chemistry offers longer cycle life and lower cost at the expense of energy density. 40-ft transit BEB from ~$950,000.
- Gillig Battery Electric: Cummins-powered electric drivetrain, strong in mid-size transit agencies. 40-ft model with 444 kWh NMC pack, ~$1.05M.
- Blue Bird Vision Electric (school bus): 155 kWh NMC battery, 120-mile range, CCS charging at 60 kW peak. MSRP ~$340,000 before incentives. Over 1,000 delivered by late 2025.
- IC Bus CE Series Electric (school bus): 210 kWh pack, up to 150-mile range, 150 kW DC charging. MSRP ~$390,000.
- Thomas Built Saf-T-Liner C2 Jouley (school bus): 226 kWh NMC, 150-mile range, Proterra-designed drivetrain. MSRP ~$410,000.
Frequently Asked Questions
What federal incentives exist for electric bus purchases in 2026?
Transit agencies can access FTA Low-No (Low or No Emission) grant funding, which has allocated billions since 2022 for BEB procurement and charging infrastructure. School districts qualify for the EPA Clean School Bus Program, offering up to $375,000 per BEB for qualifying districts (with higher awards for high-need, rural, and Tribal districts). The IRS §30D and §45W credits apply to commercial fleet vehicles under specific weight and sourcing requirements — consult a tax professional for eligibility on Class 8 vehicles. Many states layer additional incentives; California's HVIP and New York's Truck Voucher Incentive Program are among the most generous.
How long do electric bus batteries last before replacement?
Most transit BEB batteries reach 80% state of health (SoH) around years 7–9 at typical usage cycles (1 charge/discharge per day, ~250 days/year). Manufacturers warrant batteries to 70–80% capacity retention at 8–12 years. LFP chemistry (used by BYD) typically offers 3,000–5,000 cycles to 80% SoH versus 1,500–3,000 for NMC — translating to longer calendar life but larger/heavier packs for the same range.
Can electric buses tow or handle steep grades?
BEBs deliver peak torque from 0 RPM, making them excellent on grades. Transit BEBs routinely operate on 15–20% grades in cities like San Francisco and Seattle. However, sustained climbing dramatically increases energy consumption — a route with significant elevation gain may consume 40–60% more kWh/mile than a flat equivalent. Towing is not a standard BEB use case; these vehicles are designed for passenger capacity, not trailer loads.
What happens if a bus runs out of charge mid-route?
Unlike a diesel bus that can be refueled in 15 minutes from a tanker, a depleted BEB requires a flatbed tow to a charger — a 2–4 hour service disruption. Agencies mitigate this through conservative route assignment (using only 70–80% of available range), mid-day opportunity charging, and maintaining spare BEBs. Real-world strandings are rare when dispatch software accounts for battery state of charge, weather, and passenger load.
How does the electric bus market compare globally?
China dominates global BEB deployment with over 600,000 electric buses in service — primarily BYD and Yutong — driven by aggressive national mandates. Europe is the second-largest market, with cities like Oslo, Amsterdam, and Santiago (Latin America's leader) operating large BEB fleets. The U.S. market is smaller by volume but growing rapidly, with Buy America provisions (FTA requires 65% domestic content for federally funded transit vehicles) shaping which manufacturers can compete.
For fleet decision-makers, the electric bus market in 2026 offers mature technology with proven economics — but only within operational envelopes that match route distances, climate conditions, and depot infrastructure reality. The agencies succeeding with BEBs are those that treat electrification as a systems project (vehicles + charging + utility + software), not a simple vehicle swap.