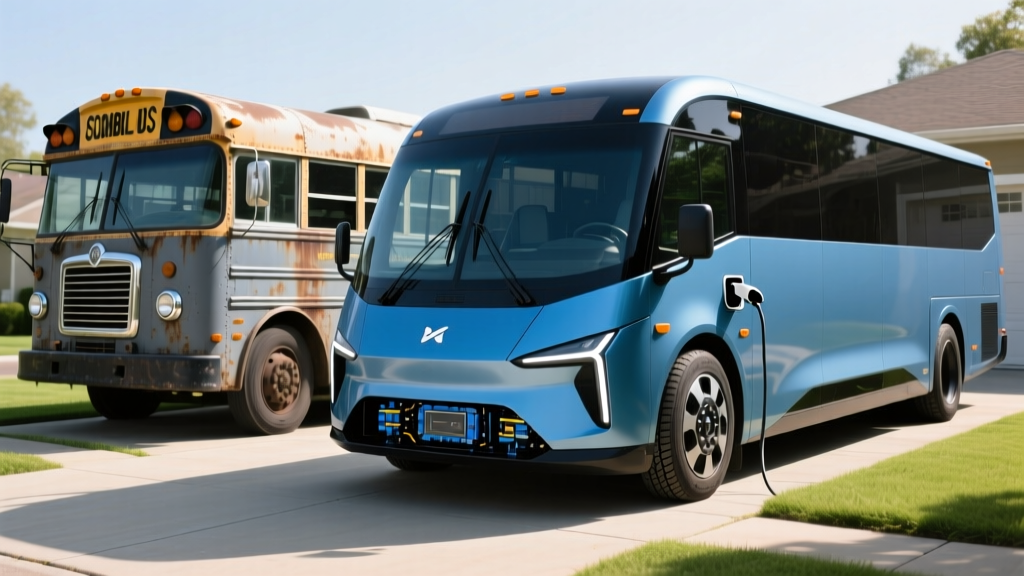
School districts across the U.S. are weighing a high-stakes procurement question: does the cost of electric school bus vs diesel ownership actually pencil out when you look beyond the sticker price? With the EPA's Clean School Bus Program distributing billions in rebates and state-level incentives stacking on top, the up-front gap has narrowed — but operational realities like route length, climate, depot charging infrastructure, and electricity rates determine whether a district saves money or burns it.
This head-to-head comparison pits the 2026 Blue Bird Vision EV (the best-selling electric Type C school bus in North America) against its sibling, the 2026 Blue Bird Vision Diesel, to isolate the variables that matter most to fleet managers, transportation directors, and school board members evaluating electrification.
Side-by-Side: 2026 Blue Bird Vision EV vs Diesel Specifications
Before we dig into lifecycle costs, here are the hard numbers that define each platform. Note that school bus specifications differ fundamentally from consumer EVs — range is measured on a stop-and-go route cycle, not highway cruising, and "cargo" translates to passenger capacity.
| Specification | Blue Bird Vision EV (2026) | Blue Bird Vision Diesel (2026) |
|---|---|---|
| Powertrain | Electric motor, rear-axle drive | Cummins B6.7L turbodiesel |
| Horsepower | ~240 HP (peak) | ~260 HP |
| Torque | ~1,500 lb-ft (motor-direct) | ~660 lb-ft |
| Battery / Fuel Capacity | ~155 kWh usable (LFP chemistry) | 65-gallon diesel tank |
| EPA / Certified Range | ~120 miles (route cycle, per EPA heavy-duty testing) | ~450 miles (est. at 7 MPG route avg) |
| Real-World Range Expectation | ~85–110 miles (cold weather, hilly routes, full load reduce range 10–25%) | ~380–430 miles |
| Charging / Refueling Speed | DC fast charge: peak 60 kW; 10–80% in ~100 min Level 2 AC: ~19 kW, full overnight charge in ~8 hrs | Diesel refill: ~10 min for 65 gal |
| Passenger Capacity | Up to 78 (Type C) | Up to 84 (Type C) |
| GVWR | ~33,000 lbs | ~33,000 lbs |
| Base MSRP (approx.) | ~$375,000–$410,000 | ~$110,000–$125,000 |
| Warranty (Powertrain/Battery) | 5 yr / unlimited mi (battery: 10 yr, 70% SoH guarantee) | 5 yr / 100,000 mi (engine) |
| Energy/Fuel Efficiency | ~1.7–2.2 kWh/mile (route-dependent) | ~5.5–7.5 MPG (route-dependent) |
Sources: Blue Bird Corporation spec sheets, EPA Clean School Bus Program documentation, manufacturer press materials. Exact specs vary by configuration and battery pack option.
Up-Front Purchase Price and Federal Incentive Landscape
The sticker-shock gap is real: a new Vision EV costs roughly 3–3.5× more than its diesel counterpart before incentives. But the incentive stack in 2026 has become the single most important variable in narrowing that gap.
Federal & State Incentive Checklist (2026)
- EPA Clean School Bus Program — Up to $375,000 per zero-emission bus + $20,000 for charging infrastructure for qualifying high-need, rural, and Tribal districts (per EPA)
- IRS §45W Commercial Clean Vehicle Credit — Up to $40,000 for heavy-duty zero-emission vehicles (commercial/government fleets; not subject to §30D consumer rules)
- IRA §13404 Qualified Alternative Fuel Vehicle Refueling Property Credit — Up to 30% of charging infrastructure costs (max $100,000 per item) in eligible census tracts
- State-level programs — Vary widely; California's HVIP, New York's Truck Voucher Incentive Program, and others can add $50,000–$250,000+ (consult your state energy office)
- Utility make-ready programs — Many investor-owned utilities cover the cost of electrical infrastructure upgrades to the depot meter
Tax credit eligibility depends on fleet structure, census tract, and sourcing rules. Consult a tax professional and review current IRS guidance before procurement.
Net Price After Maximum Incentives
| Cost Element | Vision EV | Vision Diesel |
|---|---|---|
| Base MSRP (mid-config) | $390,000 | $115,000 |
| EPA Clean School Bus Rebate (max) | −$375,000 | $0 (diesel ineligible) |
| §45W Commercial Credit | −$40,000 | $0 |
| State incentive (e.g., CA HVIP) | −$100,000 (example) | $0 |
| Net Bus Cost | ~$0–$75,000 (with full stack) | $115,000 |
| Depot charger (DC 60 kW) | +$45,000–$75,000 | $0 |
| Electrical infrastructure | +$30,000–$120,000 (panel upgrade, trenching, conduit) | $0 |
| Charging infra credit (§13404, 30%) | −$22,500–$58,500 | $0 |
| Net Total Deployment Cost | ~$52,500–$211,500 | $115,000 |
The critical insight: in best-case incentive scenarios (high-need district + strong state program + utility make-ready), an electric bus can deploy at lower net cost than a diesel bus. In worst-case scenarios (no state program, no utility support, ineligible census tract), the EV still carries a $100,000+ premium even after federal rebates.
Operating Cost: Fuel vs Electricity Per Mile
This is where the electric bus makes its strongest long-term case — and where local energy prices make or break the math.
⚡ Vision EV Energy Cost
- Average consumption: ~2.0 kWh/mile
- National commercial electricity rate: ~$0.12/kWh
- Cost per mile: ~$0.24
- Annual (12,000 mi): ~$2,880
- With managed/overnight charging ($0.07/kWh): ~$0.14/mi, $1,680/yr
🛢️ Vision Diesel Fuel Cost
- Average consumption: ~6.5 MPG (route cycle)
- National diesel price (2026 avg): ~$3.85/gal
- Cost per mile: ~$0.59
- Annual (12,000 mi): ~$7,080
- With bulk fuel contracts ($3.50/gal): ~$0.54/mi, $6,460/yr
At typical route mileage (10,000–15,000 miles/year), the Vision EV saves $3,500–$5,400 annually on energy alone — more if the district can negotiate time-of-use rates with its utility and charge overnight at off-peak commercial rates. Over a 12-year bus lifecycle, that's $42,000–$65,000 in fuel savings.
Maintenance and Lifecycle Cost Differences
Diesel school buses are maintenance-heavy by design. The Vision EV eliminates entire categories of scheduled service, which compounds savings over a typical 12–15 year fleet lifecycle.
Maintenance Cost Comparison (Annual Estimates)
| Maintenance Category | Vision EV (Annual) | Vision Diesel (Annual) |
|---|---|---|
| Engine oil changes | $0 | $800–$1,200 |
| DEF fluid (diesel exhaust fluid) | $0 | $300–$500 |
| DPF/SCR emissions system service | $0 | $1,500–$3,000 |
| Transmission service | $0 (direct-drive, no multi-speed trans) | $400–$800 |
| Brake pad replacement | $200–$400 (regen braking extends pad life 2–3×) | $800–$1,500 |
| Coolant, belts, filters | $100–$200 | $600–$1,000 |
| Electrical/battery diagnostics | $300–$600 | $100–$200 |
| Total Annual Maintenance | $600–$1,200 | $4,500–$8,200 |
Over 12 years, the maintenance differential can reach $40,000–$85,000 in favor of the electric bus. This is the second-largest cost advantage after fuel savings, and it's less variable across geographies.
Range, Charging, and Route-Matching Considerations
Range is the most operationally critical differentiator. A school bus that can't complete its route is a stranded asset, regardless of cost savings.
Which Routes Fit Electric?
| Route Profile | Vision EV Fit | Vision Diesel Fit |
|---|---|---|
| Urban/suburban, <80 miles/day, flat terrain | ✅ Excellent — well within range, regen maximizes efficiency | ✅ Excellent |
| Suburban, 80–110 miles/day, moderate hills | ⚠️ Feasible in mild weather; tight in winter | ✅ Excellent |
| Rural, 110–150+ miles/day | ❌ Exceeds reliable range; mid-route charging rarely practical | ✅ Excellent |
| Cold climate (below 20°F), any distance | ⚠️ Expect 20–30% range loss; cabin heating draws significant energy | ✅ Minimal impact |
| Split shift (AM + PM routes, midday depot charge) | ✅ Good — 3-hr midday top-up at 19 kW AC recovers ~50 miles | ✅ Excellent |
The Vision EV's 155 kWh LFP pack delivers roughly 120 miles on a standard route cycle, but real-world conditions — particularly cold weather, aggressive driving, hilly terrain, and full passenger loads — can pull that down to 85–100 miles. Districts with routes averaging under 80 miles/day in temperate climates are the strongest candidates. Rural and cold-climate districts need to evaluate carefully or consider PHEV/diesel for those specific routes.
Charging infrastructure adds deployment time: expect 6–18 months from order to energized depot, depending on utility interconnection timelines and local permitting. DC fast chargers at 60 kW take roughly 100 minutes for a 10–80% charge — fine for overnight depot charging but impractical for mid-route quick top-ups.
Category Verdicts: Where Each Bus Wins
🏆 Up-Front Cost Winner: Diesel
At $115,000 vs $390,000 pre-incentive, diesel wins outright. Even with maximum rebates, the EV only matches diesel in best-case incentive scenarios.
🏆 Operating Cost Winner: Electric
$3,500–$5,400/yr fuel savings + $3,500–$7,000/yr maintenance savings = $7,000–$12,400 annual operational advantage for EV.
🏆 Range & Flexibility Winner: Diesel
450+ mile range, 10-minute refueling, zero weather sensitivity. Diesel handles any route without operational planning.
🏆 Total 12-Year TCO Winner: Electric (conditional)
With incentives covering 70%+ of up-front cost, the EV's operational savings deliver lower total cost. Without incentives, diesel wins TCO.
🏆 Emissions & Health Winner: Electric
Zero tailpipe emissions at the bus stop and along the route — critical for student respiratory health. Upstream grid emissions depend on local energy mix.
🏆 Infrastructure Simplicity Winner: Diesel
No depot upgrades, no utility coordination, no charging management software. Diesel deploys with zero infrastructure investment.
12-Year Total Cost of Ownership Model
The following model assumes 12,000 miles/year, national average energy/fuel prices, standard maintenance schedules, and a 12-year lifecycle with no mid-life battery replacement (LFP cycle life supports this assumption for most districts).
| Cost Category | Vision EV (Best-Case Incentives) | Vision EV (No State Incentives) | Vision Diesel |
|---|---|---|---|
| Net vehicle cost (after incentives) | $75,000 | $200,000 | $115,000 |
| Charging infrastructure (net) | $50,000 | $90,000 | $0 |
| Energy/fuel (12 yrs) | $28,800 | $34,560 | $84,960 |
| Maintenance (12 yrs) | $10,800 | $12,000 | $72,000 |
| Insurance (12 yrs, est.) | $36,000 | $36,000 | $30,000 |
| 12-Year TCO | $200,600 | $372,560 | $301,960 |
| Cost Per Mile | $1.39 | $2.59 | $2.10 |
In the best-case scenario, the electric bus saves over $100,000 across 12 years compared to diesel. Without state incentives, the EV costs roughly $70,000 more over its lifecycle. The break-even point depends almost entirely on how much of the up-front premium your incentive stack covers.
Decision Framework: Which Bus Fits Your District?
Choose the Blue Bird Vision EV If:
- Your district qualifies for EPA Clean School Bus rebates (especially high-need, Title I, rural, or Tribal designations)
- Your state offers additional zero-emission bus incentives that stack with federal programs
- The majority of your routes are under 90 miles/day in moderate climates
- You have depot space for overnight Level 2 or DC charging and your utility supports make-ready investment
- Your fleet operates on predictable, repeatable routes (ideal for route-matched charging schedules)
- You're replacing buses on a 12–15 year lifecycle (longer ownership = greater operational savings)
- Student health and community air quality are board-level priorities alongside cost
Choose the Blue Bird Vision Diesel If:
- Your routes regularly exceed 100 miles/day or include significant highway segments
- You operate in consistently cold climates (below 20°F for extended periods) without heated depot storage
- Your district does not qualify for significant federal or state EV incentives
- Your utility cannot support depot charging upgrades within your procurement timeline
- You need operational flexibility for field trips, athletics, and non-route driving
- Your fleet turnover is shorter than 10 years (less time to recoup operational savings)
- Your transportation budget cannot absorb up-front infrastructure costs, even with reimbursement timelines
Frequently Asked Questions
How long does it take to charge an electric school bus overnight?
At a 19 kW Level 2 depot charger, a fully depleted 155 kWh battery requires approximately 8 hours to reach 100%. Most districts plug in at 4 PM after afternoon routes and have a full charge by midnight — well before the next morning's routes. DC fast charging at 60 kW can recover 10–80% in about 100 minutes but is more expensive to install and typically unnecessary for overnight operations.
Do electric school bus batteries need replacing during the bus's life?
LFP (lithium iron phosphate) chemistry, used in the Vision EV, is rated for 3,000–5,000+ full charge cycles before degrading below 70% State of Health. At typical school bus usage (~200 charge cycles/year), that translates to 15–25 years of service — generally exceeding the bus body's useful life. Blue Bird warranties the battery for 10 years at 70% minimum SoH. Mid-life battery replacement is unlikely for most districts but would cost $60,000–$90,000 if needed.
What happens if the grid goes down — can we still run diesel buses as backup?
Yes, and this is a legitimate operational resilience consideration. Many districts adopting electric buses retain a portion of their diesel fleet specifically for emergency operations, extended field trips, and backup coverage during power outages. A mixed fleet (e.g., 70% electric for standard routes, 30% diesel for flexibility) is a common and practical transition strategy.
Are there federal tax credits for school districts buying electric buses?
Tax-exempt entities like public school districts cannot directly claim the §45W Commercial Clean Vehicle Credit (which is structured for taxable entities). However, under the IRA's "direct pay" (elective pay) provisions enacted for tax-exempt organizations, eligible entities can receive the credit as a direct payment from the IRS. Additionally, the EPA Clean School Bus Program provides rebates that do not require tax liability. Consult your district's financial advisor and review current IRS elective pay guidance.
How do electric school buses perform in extreme cold?
Expect 20–30% range reduction at sustained temperatures below 20°F due to cabin heating demands and reduced battery efficiency. A bus rated for 120 miles may deliver 85–95 miles in deep winter conditions. Districts in northern states should size their electric routes conservatively (under 80 miles in winter) or invest in depot pre-conditioning systems that warm the battery and cabin while still plugged in, reducing the energy drawn from the pack during the first hours of operation.
What's the resale value of an electric school bus vs diesel?
Used electric school bus resale values are still establishing as the first large-scale deployments (2022–2024) age into the secondary market. Early data suggests higher uncertainty in EV residual values due to battery SoH variability. Diesel buses have a well-established secondary market with predictable depreciation curves. Factor in conservative residual values for EVs in your TCO model — typically $10,000–$25,000 at 12 years vs $15,000–$35,000 for comparable diesel.