The Quick Answer
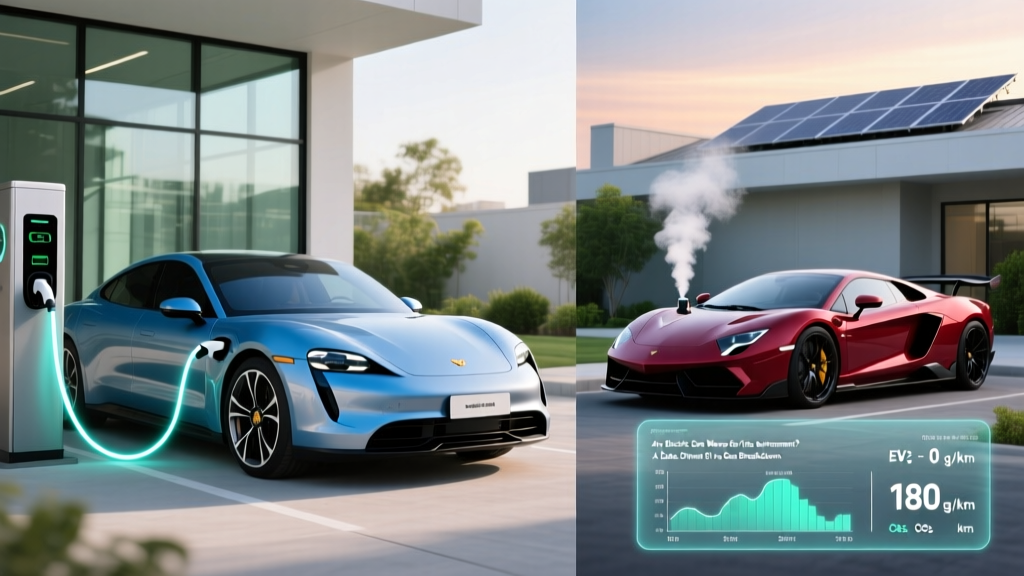
According to data compiled by AutoInsuranceEZ using NTSB and BTS figures, electric vehicles catch fire at a rate of approximately 25.1 per 100,000 vehicles sold, compared to 1,529.9 per 100,000 for gasoline vehicles and 3,474.5 per 100,000 for hybrids. EVs are roughly 61 times less likely to experience a fire than gas cars per vehicle sold. However, EV battery fires burn hotter, last longer, and are harder to extinguish — which affects insurance premiums and first-responder protocols.
Fire risk is one of the most emotionally charged topics in EV ownership. Viral videos of battery thermal runaway make headlines, while the roughly 180,000+ gas-car fires that occur annually in the U.S. barely register in the news cycle. If you've searched for "autoinsuranceez ev fire statistics" you've likely seen the headline numbers — but understanding what they actually mean for your wallet, your safety, and your buying decision requires digging into the methodology, the chemistry, and the real-world ownership math.
This guide breaks down the data, explains why EV fires behave differently, and puts the risk in context alongside insurance costs, total cost of ownership, and practical ownership considerations for 2026 buyers.
Breaking Down the AutoInsuranceEZ EV Fire Statistics
The widely cited AutoInsuranceEZ study cross-referenced data from the National Transportation Safety Board (NTSB), the Bureau of Transportation Statistics (BTS), and government recall databases to produce fire rates per 100,000 vehicles sold by powertrain type. Here are the core numbers:
| Powertrain | Fires per 100K Vehicles | Relative Risk |
|---|---|---|
| Hybrid Vehicles | 3,474.5 | Highest (baseline) |
| Gasoline Vehicles | 1,529.9 | ~2.3× lower than hybrid |
| Electric Vehicles (BEV) | 25.1 | ~61× lower than gas |
Why Hybrids Rank Highest
Hybrids carry both a gasoline fuel system and a high-voltage battery pack, doubling the potential ignition sources. They also tend to accumulate higher mileage (popular with rideshare and fleet drivers), which increases exposure. The internal combustion engine alone accounts for the majority of hybrid fire incidents — exhaust manifold heat, fuel line leaks, and oil contact with hot surfaces remain the primary culprits, just as in conventional gas cars.
Methodology Caveats You Should Know
These statistics measure fires per vehicles sold, not per vehicle-mile traveled. The EV fleet skews newer (most EVs on the road are under 5 years old), while the gas fleet includes millions of aging vehicles with deteriorating fuel lines, cracked hoses, and deferred maintenance. Age is a massive confounding variable. Additionally, the NTSB data captures all reported fires, including those from collisions, not just spontaneous events.
A more apples-to-apples comparison — say, 2023–2026 model-year vehicles only, normalized by miles driven — would narrow the gap, though EVs would still come out significantly ahead on raw fire frequency.
Why EV Fires Are Different (and Harder to Manage)
Frequency isn't the whole story. When an EV battery does catch fire, the physics of lithium-ion thermal runaway create a fundamentally different emergency:
- Temperature: Battery fires can exceed 2,000°F (1,093°C), compared to roughly 1,500°F for a gasoline fire.
- Water volume: Extinguishing a single EV battery fire can require 3,000–8,000+ gallons of water vs. 500–1,000 gallons for a gas-car fire, according to NFPA guidance.
- Re-ignition risk: Damaged lithium-ion cells can re-ignite hours or even days after initial suppression, requiring extended monitoring or vehicle submersion in water tanks.
- Toxic off-gassing: Thermal runaway releases hydrogen fluoride (HF) gas and other toxic compounds, requiring hazmat-level PPE for firefighters.
These factors don't make EV fires more likely, but they make each incident more expensive and complex to resolve. This directly impacts insurance claim costs and, by extension, your premiums.
Chemistry Matters: LFP vs NMC Fire Risk
Not all EV batteries carry the same thermal runaway risk. Lithium Iron Phosphate (LFP) cells — used in standard-range Tesla Model 3/Y, many BYD models, and the base Ford Mustang Mach-E Select — have a thermal runaway onset temperature roughly 100°C higher than Nickel Manganese Cobalt (NMC) cells. LFP chemistry is inherently more stable, releases less oxygen during decomposition, and is far less prone to cascading cell-to-cell propagation.
If fire risk is a primary concern, an LFP-equipped EV offers a meaningful safety margin over NMC packs.
EV Insurance Costs: The Fire Factor in Your Premium
Insurance companies don't price premiums on fire frequency alone. They look at total claim severity — and EV claims tend to be more expensive across multiple categories:
| Vehicle Type | Avg. Annual Premium | Key Cost Drivers |
|---|---|---|
| Compact Gas Sedan (e.g., Honda Civic) | $1,500–$1,900 | Low repair cost, high parts availability |
| Compact EV (e.g., Chevy Equinox EV) | $1,900–$2,400 | Battery replacement cost, specialized repair |
| Midsize EV (e.g., Tesla Model Y, Hyundai Ioniq 5) | $2,100–$2,800 | High repair costs, ADAS recalibration, total-loss thresholds |
| Luxury EV (e.g., BMW iX, Mercedes EQS) | $3,000–$4,200 | Very high parts cost, low-volume repair network |
The fire component specifically adds to premiums because even a minor battery enclosure damage claim can escalate to a full battery replacement ($12,000–$22,000 depending on pack size and chemistry) or a total-loss declaration. Insurers also factor in the higher cost of fire-damage claims when they do occur — a single totaled EV from a garage fire represents a $40,000–$70,000 payout versus $20,000–$35,000 for an average gas car.
How to Lower Your EV Insurance Premium
- Bundle and compare: EV insurance varies wildly by carrier. GEICO, Progressive, and State Farm often price EVs 10–20% lower than specialty insurers.
- Choose LFP trims: Some insurers are beginning to differentiate battery chemistry in underwriting.
- Garage parking: Demonstrating covered/garage parking reduces fire and theft exposure ratings.
- ADAS discounts: Vehicles with automatic emergency braking, lane-keep assist, and IIHS Top Safety Pick ratings qualify for 5–15% discounts at most carriers.
- Higher deductible: Moving from a $500 to $1,000 comprehensive/collision deductible typically saves $200–$400/year.
Total Cost of Ownership: Putting Fire Risk in Financial Context
Fire risk is one variable in a much larger ownership equation. Here's a 5-year cost comparison for a typical midsize EV versus a comparable gas SUV, using a 2026 Hyundai Ioniq 5 SEL (base MSRP ~$45,500) versus a 2026 Toyota RAV4 XLE (~$33,500 MSRP):
| Cost Category | Hyundai Ioniq 5 SEL (EV) | Toyota RAV4 XLE (Gas) |
|---|---|---|
| Purchase Price (MSRP) | $45,500 | $33,500 |
| Federal Tax Credit (§30D, if eligible) | −$3,750 to −$7,500* | $0 |
| Fuel / Electricity (5 years) | $3,200–$4,800 | $8,500–$10,200 |
| Maintenance (5 years) | $1,200–$1,800 | $3,500–$4,500 |
| Insurance (5 years) | $11,500–$14,000 | $8,000–$9,500 |
| Estimated Depreciation | $18,000–$22,000 | $12,000–$15,000 |
| Approximate 5-Year Total | $50,000–$60,000 | $53,500–$62,700 |
*Federal §30D credit eligibility depends on MSRP caps (vans/SUVs/trucks ≤$80,000; sedans ≤$55,000), buyer income limits ($150K single / $300K joint AGI), and battery critical-mineral and component sourcing requirements. Rules are subject to change — verify current eligibility at IRS.gov or consult a tax professional. Point-of-sale transfer is available at participating dealers.
The EV's higher insurance and depreciation costs are substantially offset by lower fueling and maintenance expenses. Over 5 years, the totals often converge — and the EV pulls ahead in years 6–10 as maintenance savings compound and the battery warranty (typically 8 years / 100,000 miles) provides coverage.
Common Misconceptions About EV Fires
| Myth | Fact |
|---|---|
| "EVs are constantly catching fire" | At 25.1 per 100K, EVs have the lowest fire rate of any powertrain — roughly 61× lower than gas cars per vehicle sold. |
| "Charging an EV overnight is dangerous" | Modern BMS (Battery Management Systems) actively monitor cell voltage, temperature, and state of charge. Level 2 home charging at 7–11 kW generates minimal heat. The vast majority of EV fires occur during or after collisions, not during charging. |
| "EVs are banned from parking garages due to fire risk" | No U.S. jurisdiction has enacted a blanket EV parking garage ban. A few European ferry operators and parking facilities have proposed restrictions, but these are isolated and often reversed after fire-department review. |
| "You can't put out an EV fire" | EV fires can be extinguished — they just require far more water and time. NFPA has published specific EV fire response protocols, and most metro fire departments now train on lithium-ion suppression techniques. |
| "A minor fender-bender can cause a battery fire" | Battery packs are housed in reinforced enclosures with crush zones. NHTSA crash testing includes specific battery intrusion assessments. Most low-speed impacts never contact the battery module. |
Real-World Ownership Considerations Beyond Fire Risk
Fire statistics alone shouldn't drive your EV purchase decision. Here are the practical factors that actually affect daily ownership satisfaction in 2026:
Home Charging Access
Roughly 60–70% of EV owners charge primarily at home. If you have a garage or dedicated parking spot with access to a 240V circuit, a Level 2 home charger (7.2–11.5 kW) adds 25–44 miles of range per hour of charging. Installation costs range from $500–$2,500 depending on panel capacity and run length — but this is where 80%+ of your charging will happen, and it's dramatically cheaper than public DC fast charging ($0.12–$0.18/kWh at home vs. $0.35–$0.55/kWh at public DC stations).
If you lack home charging access — apartment living, street parking, no electrical panel capacity — EV ownership becomes significantly less convenient and more expensive. In that scenario, a PHEV (like the Toyota RAV4 Prime or Hyundai Tucson PHEV) may be a better bridge, offering 30–42 miles of electric-only range for daily commutes with a gas engine for longer trips.
Climate and Range Reality
EPA range estimates assume moderate temperatures and mixed driving. In real-world conditions:
- Highway driving at 70+ mph: Expect 10–15% range reduction vs. EPA combined estimate.
- Cold weather (below 30°F): Expect 20–35% range loss without a heat pump; 15–25% with one. LFP batteries are slightly more affected by cold than NMC.
- DC fast charging in cold weather: Without battery preconditioning, charging speeds can be cut by 50%+ until cells warm up. Always precondition before arriving at a fast charger.
Driving Patterns
If 90% of your driving is under 40 miles round-trip with home charging, even a 200-mile EPA range EV will cover your needs with margin. If you regularly drive 200+ mile highway stretches or tow, you'll want 300+ miles of EPA range and access to 150+ kW DC fast chargers along your routes.
Decision Framework: Should Fire Risk Affect Your EV Choice?
Use This Framework
- If fire risk is your #1 concern → Choose an LFP-battery EV (Tesla Model 3 RWD, standard-range Model Y, BYD models). LFP chemistry offers the highest thermal stability of any current lithium-ion variant. Pair with a garage-installed Level 2 charger with a UL-listed smart charger that monitors for electrical faults.
- If you want EV benefits but want a gas backup → Choose a PHEV. You get 30–42 miles of electric-only range for daily commuting (zero tailpipe emissions on short trips) and a gas engine for road trips. Fire risk profile is closer to a conventional vehicle.
- If you lack home charging → Carefully evaluate public charging infrastructure in your area before committing to a BEV. Map your weekly routes against charging station locations. A PHEV or HEV may be more practical until home charging is available.
- If total cost is the deciding factor → Run your personal numbers: local electricity rate (¢/kWh), gas price, annual mileage, insurance quotes, and §30D eligibility. For most drivers covering 12,000–15,000 miles/year with home charging, the 5-year TCO of a mainstream EV now matches or beats a comparable gas vehicle.
Frequently Asked Questions
Are electric vehicles more likely to catch fire than gas cars?
No. By every major dataset available — including the AutoInsuranceEZ analysis of NTSB data — EVs catch fire at a dramatically lower rate per vehicle sold (25.1 per 100K) than gasoline vehicles (1,529.9 per 100K). The perception gap exists because EV fires receive outsized media coverage while the ~500 gas-car fires that happen daily in the U.S. go unreported.
Why do EV insurance premiums cost more if EVs catch fire less often?
Insurance premiums reflect claim severity, not just frequency. When EVs are in accidents, repair costs are higher due to battery replacement thresholds ($12,000–$22,000 for a pack), specialized body-shop requirements, ADAS sensor recalibration, and higher total-loss declarations. Fire claims, while rare, involve expensive total losses. These factors push premiums 15–35% higher than equivalent gas vehicles.
Is it safe to charge an EV in an attached garage overnight?
Yes. Level 2 home charging (240V, 32–48 amps) is the standard and safest way to charge. Modern EVs and UL-listed EVSE (chargers) include multiple safety layers: ground-fault protection, thermal cutoffs, cell-level voltage monitoring, and automatic charge cessation at target SoC. The NFPA and most fire marshals consider home EV charging safe when equipment is properly installed by a licensed electrician.
What EV has the lowest fire risk?
EVs using LFP (Lithium Iron Phosphate) battery chemistry have the lowest thermal runaway risk due to the chemistry's higher decomposition temperature and lower oxygen release. In 2026, LFP-equipped models include the Tesla Model 3 Rear-Wheel Drive, Tesla Model Y standard-range variants, and select trims from BYD and Ford. However, all modern EVs — regardless of chemistry — have fire rates far below gasoline vehicles.
Do EV fires release toxic chemicals?
Yes. Lithium-ion battery thermal runaway releases hydrogen fluoride (HF), carbon monoxide, and various volatile organic compounds. This is why firefighters use SCBA (self-contained breathing apparatus) and hazmat protocols for EV fires. For occupants, the vehicle's cabin filtration and early-warning systems (dashboard alerts, audible warnings) are designed to provide evacuation time before conditions become dangerous.
How does the federal EV tax credit affect the ownership cost equation?
The §30D Clean Vehicle Credit can reduce your effective purchase price by up to $7,500 for new EVs (or $4,000 for qualifying used EVs under §25E), available as a point-of-sale transfer at participating dealers. However, eligibility depends on vehicle MSRP caps, buyer income limits, and battery sourcing requirements that change periodically. Always verify current rules at IRS.gov before relying on credit amounts in your purchase math.
The Bottom Line
The AutoInsuranceEZ EV fire statistics tell a clear story: electric vehicles catch fire far less often than gasoline or hybrid vehicles on a per-vehicle basis. The 25.1 vs. 1,529.9 per 100K gap is not subtle — it's a roughly 61-to-1 difference. Where EVs differ is in fire severity: battery fires burn hotter, require more resources to suppress, and carry higher total-loss costs that ripple into insurance premiums.
For 2026 buyers, the practical takeaway is straightforward. Fire risk should not deter you from an EV purchase — the data simply doesn't support it as a material safety concern relative to gas vehicles. What should drive your decision is home charging access, realistic range for your climate and driving patterns, insurance cost quotes from multiple carriers, and whether you qualify for federal or state incentives. Run your personal numbers, get insurance quotes before you buy, and choose the powertrain that fits your actual driving life — not the headlines.