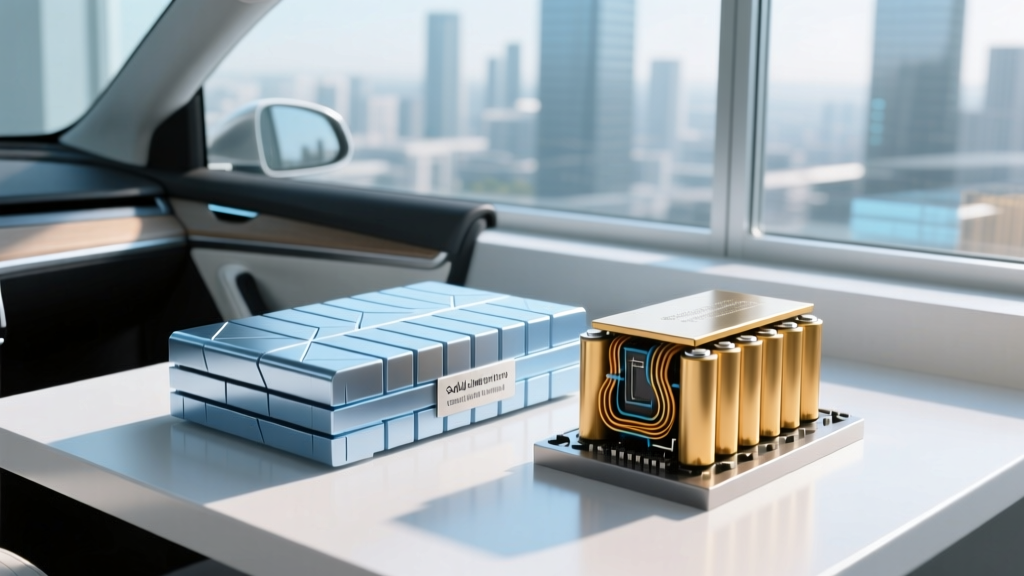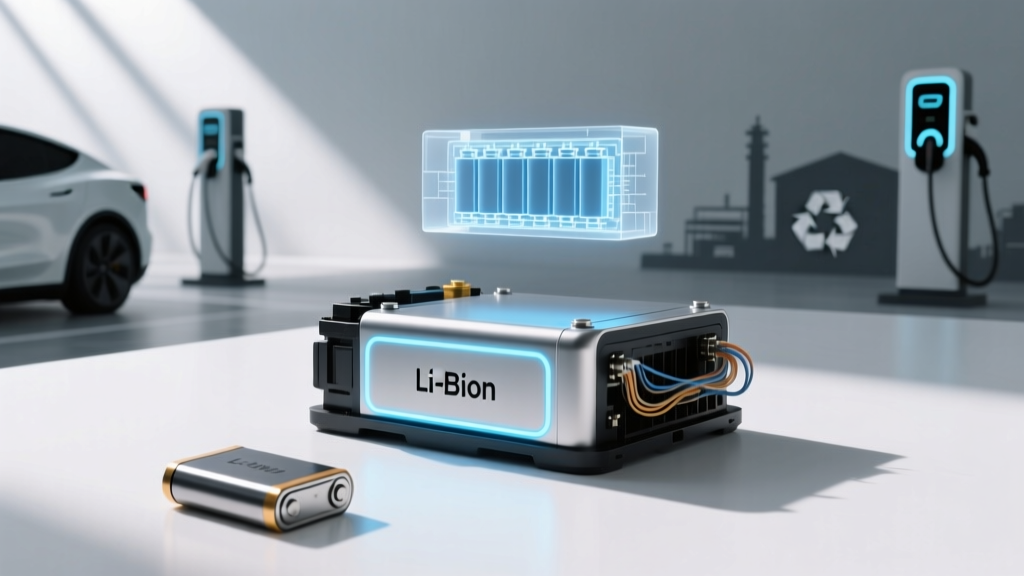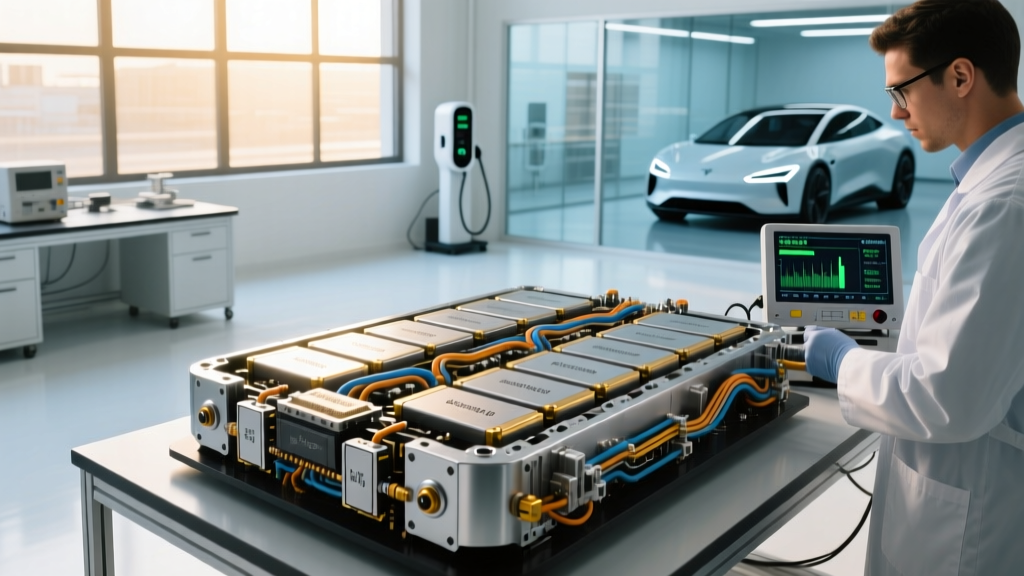
Every EV battery on the road started as a lab battery — a coin cell or pouch cell tested thousands of times in climate chambers, cycled through extreme heat and sub-zero cold, and dissected down to its cathode crystal structure before it ever touched a vehicle assembly line. Understanding that lab-to-lane journey is the single best way to make an informed EV purchase, because the chemistry validated in those tests determines your real-world range, how fast you can charge, what happens in January, and what the pack will look like at 150,000 miles.
This guide walks through what battery engineers validate in the lab, how those findings translate to the pack in your car, and what the data actually says about longevity, cost, and care in 2026.
What Lab Battery Testing Actually Validates Before a Pack Hits the Road
Before an automaker commits to a cell supplier — CATL, LG Energy Solution, Panasonic, SK On, BYD — the cells go through a multi-year validation pipeline that most buyers never see. The lab battery phase typically includes:
- Cycle-life testing: Cells are charged and discharged 1,000 to 3,000+ times at varying depths of discharge (DoD), temperatures, and C-rates (charge/discharge speeds) to model 10–15 years of use.
- Calendar aging: Cells sit at different states of charge (SoC) and temperatures for months to measure capacity loss that occurs even without cycling — critical for vehicles parked at airports or stored over winter.
- Thermal runaway characterization: Cells are intentionally abused (overcharge, nail penetration, external short) to map failure thresholds and design pack-level safety systems.
- Impedance spectroscopy: Engineers measure internal resistance changes over time, which predict power fade (acceleration and charge-rate loss) separately from energy fade (range loss).
- Charge-curve mapping: The exact kW acceptance at each SoC percentage is plotted — this is what determines the "peak 250 kW" claim and the taper above 80% you experience at a DC fast charger.
The result of this lab work is a cell specification sheet that defines the usable kWh window (e.g., 77.4 kWh usable out of an 84 kWh gross pack), the recommended charge limits, the thermal management targets, and the warranty capacity-retention floor the automaker is willing to guarantee.
LFP vs NMC vs NCA: Chemistry Trade-Offs Validated in the Lab
The two dominant cathode chemistries in 2026 passenger EVs are LFP (lithium iron phosphate) and NMC/NCA (nickel manganese cobalt / nickel cobalt aluminum). Each was refined through years of lab battery iteration, and the trade-offs are physics-driven, not marketing-driven.
| Attribute | LFP (LiFePO₄) | NMC / NCA |
|---|---|---|
| Energy density (cell-level) | 160–180 Wh/kg | 250–300 Wh/kg |
| Typical cycle life (80% retention) | 3,000–5,000 cycles | 1,000–2,000 cycles |
| Cold-weather range loss (~20°F) | ~30–40% loss | ~20–30% loss |
| Recommended daily SoC | 100% OK (no calendar-aging penalty) | 80% preferred for daily |
| Cell cost (2026 est.) | ~$70–85 / kWh | ~$100–130 / kWh |
| Cobalt/nickel content | None | Significant (supply-chain & ESG factor) |
| Common in (2026 models) | Tesla Model 3 RWD, BYD, Ford Mustang Mach-E Select (LFP trims) | Hyundai Ioniq 5, Tesla Model Y LR, Rivian, BMW iX |
| DC fast-charge speed | Moderate (peak ~170 kW typical) | High (peak 200–350 kW on 800V architectures) |
Which is better? There is no universal winner. LFP is the cost-effective, long-life, daily-commuter chemistry — ideal if you charge at home, drive under 250 miles a day, and want to charge to 100% without guilt. NMC/NCA is the road-trip and performance chemistry — higher energy density means more range in the same pack volume, faster peak charging, and better cold-weather behavior, but it demands more careful SoC management and carries a higher per-kWh cost. The lab data is unambiguous: choose based on your driving pattern, not brand loyalty.
How Long Do EV Batteries Actually Last? Degradation Data by the Numbers
The most common question from prospective buyers: will I need a new battery before the car is paid off? The data says almost certainly not. Here is what real-world fleet and lab-validated data shows:
Typical Degradation Curve (NMC packs, fleet averages):
- Year 1 / 15,000 mi: ~2–3% capacity loss (initial formation loss)
- Year 3 / 45,000 mi: ~6–8% total loss
- Year 5 / 75,000 mi: ~8–11% total loss
- Year 8 / 120,000 mi: ~10–15% total loss
- Year 10 / 150,000 mi: ~12–18% total loss
Sources: Geotab fleet battery health study, Recurrent Auto battery data reports.
LFP packs tend to show a flatter degradation curve — less initial drop, more gradual linear decline — which is why many LFP-equipped vehicles retain 90%+ capacity at 100,000 miles. NMC packs typically show a steeper initial loss (the "formation" phase) that then flattens considerably.
A critical nuance: degradation is not linear, and it accelerates primarily under three conditions — sustained high-SoC storage in heat, frequent DC fast charging above 150 kW without preconditioning, and repeated deep discharges below 10%. Avoid those three patterns and the lab-predicted curves hold remarkably well in the real world.
What the Battery Warranty Actually Covers — and What It Doesn't
Federal law (EPA emissions-warranty precedent) and market competition have standardized EV battery warranties around a common floor. Here is what the major automakers guarantee as of the 2026 model year:
| Automaker | Duration | Mileage | Capacity Retention Threshold |
|---|---|---|---|
| Tesla (Model 3/Y LFP) | 8 years | 120,000 mi | 70% |
| Tesla (Model 3/Y LR, S, X) | 8 years | 150,000 mi | 70% |
| Hyundai / Kia | 10 years | 100,000 mi | 70% |
| Ford (Mach-E, F-150 Lightning) | 8 years | 100,000 mi | 70% |
| General Motors (Ultium) | 8 years | 100,000 mi | 70% |
| Rivian | 8 years | 175,000 mi (R1T/R1S) | 70% |
| BMW | 8 years | 100,000 mi | 70% |
What's covered: Capacity loss below the stated threshold (e.g., if your 82 kWh pack drops below 57.4 kWh usable within 8 years / 100,000 miles, the manufacturer replaces or remanufactures the pack at no cost). Defects in materials, workmanship, and battery management system (BMS) failures are also covered.
What's typically NOT covered: Cosmetic damage, damage from accidents or flooding, degradation from using non-approved charging equipment, and capacity loss above the threshold (i.e., a pack at 72% capacity at year 7 is considered "normal" and is not warrantable).
For full federal warranty and tax-credit eligibility details, consult the IRS §30D clean vehicle credit page, as battery sourcing requirements now intersect with warranty and credit qualification.
EV Battery Replacement Cost: What the Numbers Say in 2026
This is where fear-mongering runs rampant, so let's anchor in actual data. A full high-voltage traction battery replacement is rare — the vast majority of EV batteries outlast the vehicle's economic life. But when it is needed (typically beyond 150,000 miles or after physical damage), here is what it costs:
| Vehicle / Pack Size | Battery kWh | Replacement Cost (Parts + Labor) | Typical Trigger |
|---|---|---|---|
| Tesla Model 3 RWD (LFP) | ~60 kWh | $10,000 – $13,000 | Post-warranty degradation or collision |
| Hyundai Ioniq 5 (NMC) | ~77.4 kWh | $13,000 – $18,000 | Post-warranty or module failure |
| Ford F-150 Lightning Ext. Range | ~131 kWh | $20,000 – $28,000 | Rare; mostly fleet/high-mileage |
| Chevrolet Silverado EV | ~200 kWh | $28,000 – $38,000 | Very rare; largest consumer pack |
| Nissan LEAF (40 kWh, older) | 40 kWh | $6,500 – $9,000 | Air-cooled pack, higher degradation risk |
Two important contextual points. First, cell prices have dropped roughly 85% since 2010 (from ~$1,200/kWh to ~$100–130/kWh for NMC at the pack level in 2026), and that trend continues — a replacement in 2032 will likely cost significantly less than today. Second, many shops now offer module-level replacement rather than full-pack swaps: if only 2 of 16 modules have degraded, replacing just those modules can cost $2,000–$5,000 instead of the full pack price.
Factors That Accelerate (or Preserve) Battery Health
The lab battery tests isolate each variable; in the real world, they compound. Here are the five factors with the largest measured impact on long-term State of Health (SoH):
- State of charge habits (largest daily impact): For NMC packs, parking at 100% SoC for days — especially in heat above 85°F — accelerates calendar aging measurably. Set your daily charge limit to 80% and only charge to 100% when you'll drive within hours. LFP packs tolerate 100% daily charging without meaningful penalty.
- DC fast-charging frequency: Occasional road-trip fast charging is fine. Daily reliance on 150+ kW DC fast charging without battery preconditioning adds ~1–2% extra degradation per year versus Level 2 home charging. Preconditioning (the car warming the battery before you arrive at the charger) is critical — it's why Tesla navigation-routed Supercharging and Hyundai's preconditioning feature exist.
- Temperature extremes: Sustained operation above 95°F battery temperature or below 15°F without thermal management degrades cells faster. Active liquid-cooled packs (standard on nearly all 2026 EVs except the base Nissan LEAF) mitigate this substantially. Garage parking in extreme climates adds measurable pack life.
- Depth of discharge: Regularly draining below 10% SoC stresses NMC cells. The BMS maintains a bottom buffer (typically 2–5 kWh hidden below "0%"), but habitually running the battery near empty still accelerates wear. Charge when you hit 15–20%.
- Storage conditions: If you store an EV for weeks (airport parking, seasonal use), leave it at ~50% SoC in moderate temperatures. Storing at 100% in summer heat is the single worst thing you can do to an NMC pack.
How to Check Your Battery's State of Health (SoH)
State of Health (SoH) is the percentage of original capacity your pack retains — a 77.4 kWh pack at 92% SoH holds about 71.2 kWh usable. Monitoring SoH lets you project range, plan for warranty claims, and assess a used EV's value. Here are the primary methods:
- In-car battery health displays: Tesla's Service Mode (accessible via the software menu) shows a battery health percentage. Hyundai/Kia's infotainment system includes an EV battery-state screen on 2024+ models. Nissan LEAF displays "capacity bars" (12 bars = new, each lost bar ≈ 6.25% degradation).
- OBD-II diagnostic tools: Devices like the OBDLink SX paired with apps such as Leaf Spy (Nissan) or ABRP (any EV) read BMS-reported SoH, cell voltage variance, and pack temperature directly.
- Third-party battery reports: Services like Recurrent and Geotab offer fleet and individual battery health reports. Some dealerships now provide a certified battery health report for CPO EV sales.
- Manual calculation: Charge to 100% (or a known SoC), note the displayed range, and compare it to the EPA-rated range when new. A 310-mile EPA vehicle showing 275 miles at 100% SoH suggests roughly 89% SoH (accounting for temperature and driving-style variance).
For used-EV buyers, a battery health report should be treated as critically as a Carfax — it's the single largest cost variable in the vehicle's remaining life.
What Comes After: Solid-State, Silicon Anode, and Sodium-Ion
Lab battery research in 2026 is advancing on three fronts, each with realistic — not hype-cycle — timelines:
Solid-state batteries (SSBs): These replace the liquid electrolyte with a solid ceramic or polymer layer, promising 40–50% higher energy density, faster charging (potentially 10–80% in under 10 minutes), and near-zero fire risk. Toyota, Samsung SDI, and QuantumScape have demonstrated prototype cells, and Toyota has announced a 2027–2028 limited production target. However, manufacturing yield, cost ($/kWh still 2–3× current NMC), and cycle-life validation at scale remain unsolved. Realistic mass-market availability: 2029–2032.
Silicon-dominant anodes: Replacing graphite anodes with silicon can boost energy density 20–40% without changing the cathode. Sila Nanotechnologies and Group14 are already supplying silicon-carbon composite anodes to Mercedes-Benz (EQG) and other OEMs in limited 2025–2026 production. Expect this to become mainstream in NMC packs by 2027–2028 as a near-term range and charge-speed improvement.
Sodium-ion batteries: CATL and BYD have begun producing sodium-ion cells for budget EVs in China, eliminating lithium entirely. Energy density is lower (~140 Wh/kg), but raw-material cost is dramatically cheaper and cold-weather performance is excellent. These are unlikely to appear in US-market vehicles before 2028 but are a serious contender for affordable compact EVs globally.
None of these technologies are available in a 2026 production vehicle you can buy today. Treat any automaker claiming "solid-state is here" as marketing, not engineering.
Frequently Asked Questions
How long do EV batteries last in years and miles?
Based on fleet data from Geotab and Recurrent, the average liquid-cooled NMC EV battery retains 82–88% of its original capacity at 150,000 miles (roughly 10 years of average US driving). LFP packs typically retain 88–93% at the same mileage. Most EV batteries will outlast the vehicle's body, suspension, and interior before dropping below 70% capacity. Full replacement within the warranty period is statistically rare — well under 2% of vehicles according to manufacturer warranty claim data.
How much does an EV battery cost to replace in 2026?
Full pack replacement ranges from ~$6,500 for a small pack (Nissan LEAF 40 kWh) to $28,000–$38,000 for the largest consumer packs (Chevrolet Silverado EV 200 kWh). The most common mid-size packs (Tesla Model 3, Hyundai Ioniq 5) fall in the $10,000–$18,000 range including labor. Module-level repairs, where only degraded segments are replaced, can cost $2,000–$5,000. Prices continue to decline as cell costs fall year over year.
What does the EV battery warranty cover?
Standard warranties guarantee that the high-voltage traction battery will retain at least 70% of its original capacity for 8–10 years / 100,000–175,000 miles (varies by automaker — see warranty table above). Defects in the battery management system, cooling system, and cell modules are covered. The warranty does not cover damage from collisions, flooding, or improper charging equipment, nor does it cover capacity loss above the threshold. The 12V auxiliary battery (which powers lights, infotainment, and door locks) is covered under a separate, shorter warranty — typically 3 years / 36,000 miles — and is a completely different component from the traction battery.
How do I check and maximize my EV battery health?
Check SoH through your vehicle's built-in battery health screen, an OBD-II diagnostic tool, or a third-party service like Recurrent. To maximize longevity: set daily charge limits to 80% for NMC (100% is fine for LFP), avoid parking at high SoC in extreme heat, use DC fast charging sparingly (Level 2 home charging is gentler), enable battery preconditioning before fast charging, and avoid habitually draining below 15% SoC. See the battery care checklist above for the full breakdown.
LFP vs NMC — which battery chemistry should I choose?
Choose LFP if: you charge at home most nights, your daily driving is under 250 miles, you want to charge to 100% without managing SoC, you prioritize lowest cost of ownership, and you live in a moderate climate. Choose NMC/NCA if: you regularly take road trips over 300 miles, you need maximum range in a given vehicle, you frequently drive in cold climates (below 30°F), you want the fastest DC fast-charge speeds (200–350 kW on 800V platforms), or you need the lightest possible pack for performance applications. Neither chemistry is "better" in absolute terms — the lab data supports both for different use cases.
Will solid-state batteries make my current EV obsolete?
Not for at least 4–6 years. Solid-state batteries remain in the lab and limited-prototype phase as of 2026, with mass production not expected before 2029–2032. Even when they arrive, they will debut in premium vehicles at high prices before reaching mainstream models. Your current NMC or LFP pack, properly maintained, will serve reliably through the 2030s. The more immediate improvement to watch is silicon-anode adoption, which will incrementally boost range and charge speed in NMC packs starting in 2027.
Authoritative sources referenced: EPA Fuel Economy / fueleconomy.gov for range and efficiency data; IRS §30D Clean Vehicle Credit guidelines for battery-sourcing and tax-credit eligibility; manufacturer warranty documentation from Tesla, Hyundai, Ford, GM, Rivian, and BMW press sites.