Why Battery Voltage Monitoring Matters for EV Owners
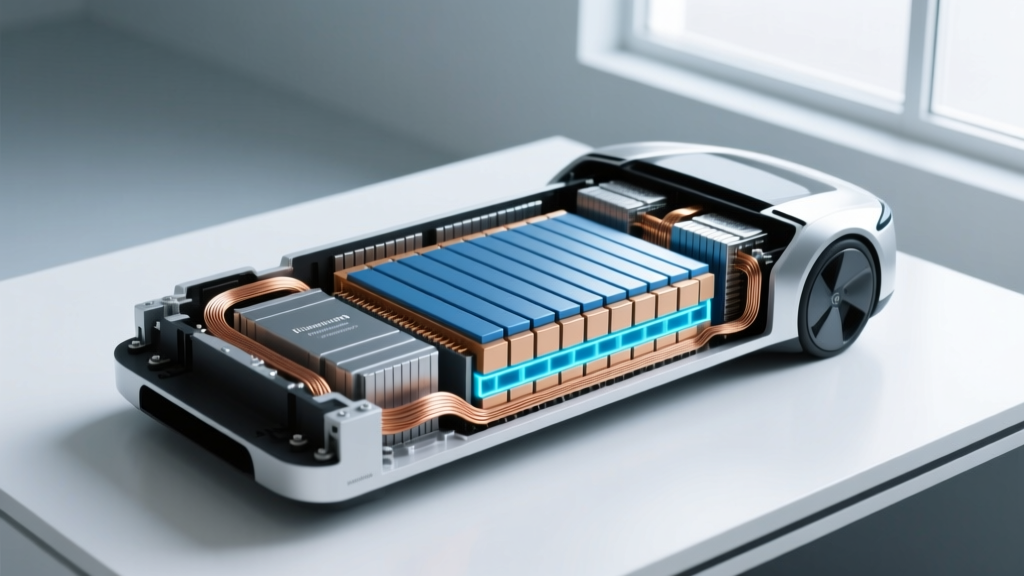
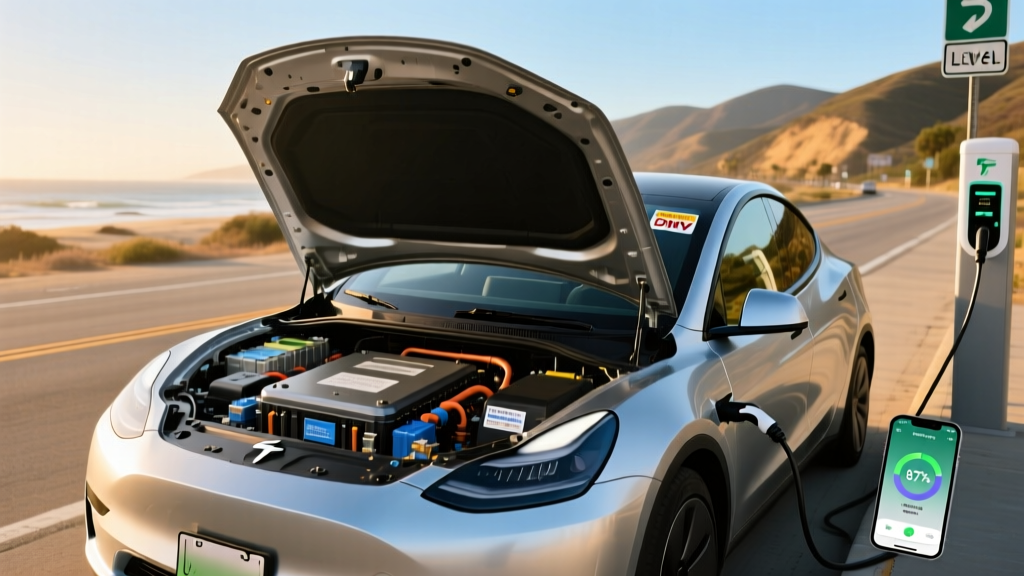
Most EV owners plug in, walk away, and trust the battery management system (BMS) to handle the rest. But for drivers who want granular insight into pack health, a car charger with battery voltage readouts — whether built into the vehicle's telemetry, accessible via OBD-II scanners, or displayed on advanced Level 2 home charging stations — provides a window into cell-level behavior that range estimates alone can't reveal.
Voltage monitoring tells you how evenly cells are balancing, whether the pack is experiencing unusual sag under load, and whether capacity has degraded beyond what the dashboard range estimator suggests. It's the difference between knowing your EV shows 280 miles of range and understanding why it dropped from 310 miles over two years.
This guide covers the chemistry behind your traction battery, real-world degradation data, warranty protections, replacement economics, and how voltage-aware charging habits can extend pack life well past 200,000 miles.
LFP vs NMC vs NCA: Choosing Your Battery Chemistry
The two dominant lithium-ion chemistries in 2026-model EVs are LFP (lithium iron phosphate) and NMC/NCA (nickel manganese cobalt / nickel cobalt aluminum). Each has distinct trade-offs that affect range, longevity, charging behavior, and how you should interpret voltage readings from your charger.
| Attribute | LFP (LiFePO₄) | NMC / NCA |
|---|---|---|
| Energy Density | 160–200 Wh/kg (lower) | 220–300 Wh/kg (higher) |
| Cycle Life | 3,000–6,000+ cycles | 1,000–2,500 cycles |
| Cold Performance | Moderate — greater range loss below 32°F | Better low-temp discharge capability |
| Recommended Daily SoC | 100% (regular full charges are fine) | 80% daily; 100% for trips only |
| Thermal Stability | Excellent — higher runaway threshold | Good — requires robust BMS cooling |
| Cost per kWh | ~$80–$100 (lower) | ~$110–$140 (higher) |
| Voltage Curve | Very flat — SoC estimation harder | Linear slope — easier voltage-based SoC |
| Common 2026 Vehicles | Tesla Model 3/Y RWD, Ford Mustang Mach-E Select, BYD models | Hyundai Ioniq 5/6, Kia EV6/EV9, Chevy Equinox EV, BMW iX |
Which Chemistry Is Better?
Neither is universally superior. LFP wins on longevity and daily convenience — you can charge to 100% nightly without accelerating degradation, and the cycle life is 2–3× longer. The trade-off is heavier weight for the same kWh, meaning slightly less range in an equivalently sized pack, and a flatter voltage curve that makes SoC estimation less precise via voltage alone.
NMC/NCA wins on energy density and cold-weather usability, which is why long-range and performance trims (and most AWD configurations) still use it. If you live in northern climates and need maximum range from a given battery volume, NMC remains the practical choice — but you'll want to follow the 80% daily charge guideline.
Real-World EV Battery Degradation: What the Data Shows
The fear of catastrophic battery failure persists, but fleet data and long-term owner reports tell a different story. Modern EV batteries are engineered for gradual, predictable capacity loss — not sudden cliff-edge failure.
- Tesla Model 3/Y (NMC, 2020–2023): Average ~5–7% capacity loss at 100,000 miles; ~8–12% at 150,000 miles (Tesla Impact Report)
- Chevrolet Bolt EV/EUV (NMC, 2017–2023): Most owners report 6–10% loss at 80,000–100,000 miles; some early 2017 models saw higher loss linked to manufacturing defects covered under recall
- Hyundai Kona Electric / Ioniq 5 (NMC): ~4–6% loss at 60,000–80,000 miles based on owner forum aggregations
- LFP packs (Tesla Model 3 RWD, 2022+): Early data suggests 2–4% loss at 50,000 miles, with a flatter degradation curve projected
- Nissan Leaf (passive air cooling, 2011–2017): Notable outlier — 15–25%+ loss at 80,000 miles due to lack of active thermal management; 2018+ models with liquid cooling improved significantly
Sources: fueleconomy.gov, Tesla Impact Reports, Recurrent Auto battery data, owner community aggregations. Individual results vary based on climate, charging habits, and DC fast-charge frequency.
A critical nuance: degradation is non-linear. Most packs lose 2–4% in the first year (initial formation loss), then settle into a slow, steady decline of roughly 1–2% per year or 10,000–15,000 miles. A sudden drop in range usually indicates a cell imbalance or BMS recalibration event, not accelerating degradation.
How Voltage Monitoring Reveals Degradation
When your car charger with battery voltage display shows individual cell group readings (or when you access them via OBD-II tools like Leaf Spy, Scan My Tesla, or Car Scanner), you can spot degradation patterns:
- Cell voltage spread: Healthy packs show cell groups within 10–20 mV of each other at rest. A spread exceeding 50 mV suggests cell imbalance.
- Voltage sag under load: Excessive sag during acceleration or fast charging indicates increased internal resistance — a hallmark of aging.
- Charge termination voltage: If the pack reaches its upper voltage limit with less energy (kWh) added than when new, capacity has decreased.
EV Battery Warranty Terms: What's Actually Covered
Federal law mandates a minimum 8-year/100,000-mile warranty on EV battery packs for emissions-related compliance, and most manufacturers meet or exceed this baseline. California and states adopting CARB standards require 10 years/150,000 miles.
| Manufacturer / Model | Warranty Term | Capacity Retention Threshold | Notes |
|---|---|---|---|
| Tesla (Model 3/Y RWD — LFP) | 8 yr / 100,000 mi | 70% | Long Range/Performance: 8 yr / 120,000 mi |
| Hyundai (Ioniq 5/6) | 10 yr / 100,000 mi | 70% | 10 yr applies nationwide (not just CARB states) |
| Kia (EV6/EV9) | 10 yr / 100,000 mi | 70% | Same structure as Hyundai |
| Ford (Mustang Mach-E, F-150 Lightning) | 8 yr / 100,000 mi | 70% | Covers battery and electric drivetrain components |
| Chevrolet (Equinox EV, Blazer EV) | 8 yr / 100,000 mi | 60% (Bolt); 70% (Ultium platform) | Ultium platform improved threshold over Bolt era |
| BMW (iX, i4) | 8 yr / 80,000 mi | 70% | Lower mileage cap than most competitors |
Key warranty fine print: The capacity retention threshold (typically 70%) means the manufacturer will repair or replace the battery only if measured usable capacity drops below that percentage of original within the warranty window. Normal, gradual degradation above the threshold is not a warranty claim. Most manufacturers assess capacity via dealer diagnostic tools rather than the owner's dashboard readout.
EV Battery Replacement Cost: Numbers and Context
Out-of-warranty battery replacement is the single biggest fear among prospective EV buyers. Here's what it actually costs in 2026 — and why most owners will never face this expense.
| Vehicle / Pack Size | Battery kWh | Estimated Replacement Cost | Notes |
|---|---|---|---|
| Tesla Model 3 RWD (LFP) | ~60 kWh | $8,000–$12,000 | LFP packs are cheaper; module-level repair may reduce cost |
| Tesla Model Y Long Range (NMC) | ~75 kWh | $12,000–$16,000 | Full pack replacement at service center |
| Hyundai Ioniq 5 (NMC) | 77.4 kWh | $14,000–$18,000 | E-GMP platform; module service possible |
| Ford F-150 Lightning Ext. Range | ~131 kWh | $20,000–$28,000 | Largest consumer pack; cost scales with kWh |
| Chevrolet Bolt EV (older NMC) | 65 kWh | $14,000–$16,000 | Post-recall replacement packs; many covered under warranty |
Context that matters: Battery cell prices have fallen from ~$350/kWh in 2015 to roughly $100–$130/kWh at the pack level in 2026, and are projected to continue declining. Additionally, many EV batteries outlast the vehicle itself — data from Recurrent Auto shows that fewer than 1.5% of EVs in their studied fleet have required battery replacement outside of warranty recalls. The typical EV battery will retain 80–90% of its original capacity at 150,000 miles.
Module-level repair (replacing individual cell modules rather than the entire pack) is increasingly available through independent EV shops and can reduce costs by 50–70% when only a few modules have degraded disproportionately.
How Long Do EV Batteries Actually Last?
The straightforward answer: most EV batteries will last 15–20 years or 200,000–300,000 miles before degrading to 70–80% of original capacity — still usable, just with reduced range. They don't "die" the way a 12V lead-acid battery does; they slowly hold less energy.
LFP packs are projected to exceed 300,000 miles to reach 80% SoH (State of Health) based on their 3,000–6,000 cycle ratings. At an average of 250 miles per full cycle, that translates to 750,000–1,500,000 theoretical miles — though calendar aging and real-world conditions reduce this to a more conservative 250,000–400,000 miles in practice.
NMC packs typically reach 80% SoH around 150,000–250,000 miles depending on charging habits and thermal management quality. Vehicles with active liquid cooling and heat pumps (standard on most 2026 models from Hyundai, Kia, Tesla, Ford, and GM) consistently outperform passively cooled designs.
Factors That Accelerate Battery Degradation
- Avoid sustained 100% SoC (NMC/NCA only): Set daily charge limit to 80%. LFP owners can charge to 100% regularly — in fact, periodic full charges help the BMS recalibrate cell balancing.
- Minimize DC fast charging frequency: Occasional road-trip fast charging is fine. Daily reliance on 150+ kW DC charging accelerates degradation by ~1–2% over 100,000 miles compared to Level 2 only. Use Level 2 (7–11.5 kW) for daily charging.
- Precondition before fast charging: Most EVs automatically precondition the battery when a Supercharger or DC station is navigated to. This brings cells to optimal temperature (roughly 85–95°F) and reduces stress. If your EV doesn't auto-precondition, allow 15–20 minutes of driving before plugging into DC.
- Avoid extreme SoC storage: Don't leave the vehicle sitting at 100% or below 10% for extended periods (weeks). For long-term storage, aim for 50–60% SoC.
- Park in shade or garages during extreme heat: Sustained battery temperatures above 104°F (40°C) accelerate calendar aging. Active thermal management mitigates this, but reducing exposure helps.
- Don't obsess over avoiding low SoC: Driving down to 10–15% occasionally is fine. The BMS maintains a buffer below the displayed 0% to protect cells from true over-discharge.
The Fast-Charging Question
DC fast charging generates significant heat due to high current (often 300–500 amps at the cell level). Modern packs handle this through active cooling, but repeated thermal cycling still contributes to electrolyte decomposition over time. A 2024 study by Recurrent Auto analyzing over 12,500 EVs found that vehicles fast-charging more than 90% of the time showed roughly 2–3% additional degradation at 100,000 miles compared to those primarily using Level 2 — meaningful but not catastrophic.
How to Check and Monitor Your EV Battery Health
Method 1: In-Vehicle Telemetry
Most 2026 EVs provide a basic State of Health (SoH) indicator in the infotainment system or companion app. Tesla's app shows estimated range vs. original; Hyundai/Kia's Bluelink/UVO provides battery condition status. These are useful for trends but lack cell-level detail.
Method 2: OBD-II Diagnostic Tools
For granular data, an OBD-II Bluetooth adapter paired with apps like Scan My Tesla (Tesla-specific), Leaf Spy Pro (Nissan Leaf), or Car Scanner ELM OBD2 (broad compatibility) can display:
- Individual cell group voltages (mV precision)
- Pack voltage and current in real time
- Battery temperature per sensor zone
- Calculated SoH percentage based on measured vs. original capacity
- Charge/discharge energy counters (kWh in/out)
Method 3: Car Charger With Battery Voltage Display
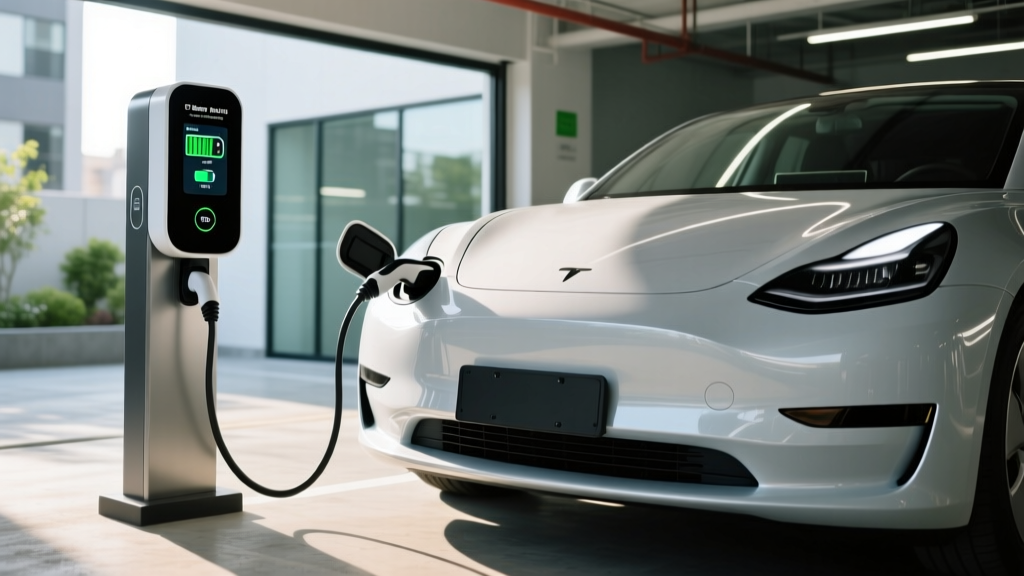
Some advanced Level 2 home chargers — including select models from ChargePoint, Emporia, and Wallbox — integrate with vehicle APIs to display battery voltage, SoC, and estimated health metrics directly in the charger's companion app. While not as granular as OBD-II tools, these provide convenient daily monitoring without additional hardware.
When using a car charger with battery voltage readout, pay attention to:
- Voltage at full charge vs. historical baseline: A declining peak voltage over months may indicate capacity loss.
- Charge acceptance rate: If the charger reports sustained kW declining faster than expected as SoC rises, the charge curve is shifting — a normal aging pattern.
- Temperature delta during charging: Large temperature swings between cell zones suggest cooling system issues.
Method 4: Dealer Diagnostic
Manufacturers can perform a full capacity test via dealer diagnostic tools, typically measuring actual kWh delivered from 0–100% under controlled conditions. This is the most authoritative SoH measurement and is required for warranty claims.
Emerging Battery Technologies: What's Next
Several next-generation battery technologies are in development, but none are commercially available in consumer EVs as of 2026. Here's a realistic timeline assessment:
Solid-State Batteries
Solid-state cells replace the liquid electrolyte with a solid material (ceramic, sulfide, or polymer), promising higher energy density (~400–500 Wh/kg), faster charging, and improved safety. Toyota has announced limited production for 2027–2028, but initial deployment will likely be in low-volume, premium applications. Mass-market availability is projected for 2030+. Samsung SDI, QuantumScape, and Solid Power are also in advanced testing phases.
Silicon Anode Cells
Replacing graphite anodes with silicon increases theoretical capacity by up to 10× at the anode level. Companies like Sila Nanotechnologies and Group14 are supplying early production cells, with the Mercedes G-Class EV (2025) among the first to use silicon-dominant anodes. Expect broader adoption in 2027–2029 model years, initially in performance and luxury segments.
Sodium-Ion Batteries
Sodium-ion chemistry eliminates lithium and cobalt entirely, offering lower cost and excellent cold performance at the expense of energy density (~120–160 Wh/kg). CATL and BYD are deploying these in Chinese-market city cars. US-market availability remains uncertain and likely limited to budget/urban segments post-2028.
Frequently Asked Questions
How long do EV batteries last in years and miles?
Most modern EV batteries (2020+) are designed to last 15–20 years or 200,000–300,000 miles before reaching 70–80% of original capacity. LFP chemistry packs may exceed 300,000 miles to 80% SoH. Batteries rarely fail catastrophically — they gradually hold less energy, reducing range but remaining functional.
How much does it cost to replace an EV battery?
Full pack replacement ranges from roughly $8,000 for a smaller LFP pack (e.g., Tesla Model 3 RWD) to $20,000–$28,000 for large packs like the F-150 Lightning Extended Range (131 kWh). Module-level repair can reduce costs by 50–70%. However, fewer than 1.5% of EVs have required out-of-warranty battery replacement based on fleet data.
What does the EV battery warranty cover?
Standard warranties cover battery capacity loss below a specified threshold (typically 70% of original) within 8 years/100,000 miles (10 years/150,000 miles for Hyundai/Kia and in CARB states). They also cover manufacturing defects and component failures. Normal gradual degradation above the threshold is expected and not warrantable.
How do I check my EV battery health?
You can monitor battery health through: (1) the vehicle's built-in telemetry and companion app, (2) OBD-II diagnostic tools like Scan My Tesla or Car Scanner showing cell voltages and SoH, (3) a car charger with battery voltage monitoring that tracks charging patterns over time, or (4) a dealer diagnostic test for the most authoritative capacity measurement.
LFP vs NMC — which battery chemistry is better for me?
Choose LFP if you prioritize longevity, want the convenience of daily 100% charging, and don't need maximum range per kWh of battery weight. Choose NMC/NCA if you need longer range, live in cold climates where NMC performs better, or want a performance-oriented trim. Both chemistries will outlast the typical ownership period with proper care.
Does frequent DC fast charging damage the battery?
Exclusive reliance on DC fast charging adds roughly 2–3% additional degradation over 100,000 miles compared to primarily Level 2 charging. Occasional fast charging on road trips is not a concern. The bigger risk is heat accumulation — always allow preconditioning before fast charging, and avoid back-to-back DC sessions in hot weather when possible.
Can I use a car charger with battery voltage display on any EV?
Voltage display capability depends on the charger's integration with the vehicle's communication protocol. Most Level 2 chargers communicate via the J1772/NACS pilot signal, which provides SoC and power data but not always individual cell voltages. For cell-level detail, an OBD-II adapter is more universally compatible. Check charger specifications for vehicle API integration support.
Sources referenced: fueleconomy.gov (EPA range and efficiency data), Tesla Impact Report (fleet degradation data), Recurrent Auto (battery longevity studies). Tax credit eligibility under IRS §30D is subject to income, MSRP, and battery sourcing requirements — consult irs.gov for current rules.