Reading a Battery Car Diagram: What You're Actually Looking At
Search for "battery car diagram" and you'll find skateboard-platform illustrations showing a flat, rectangular pack slung between the axles. That pack is the single most expensive component in any electric vehicle — typically 30–40% of the vehicle's build cost — and understanding its anatomy, chemistry, and aging behavior is the fastest way to become a smarter EV buyer or owner.
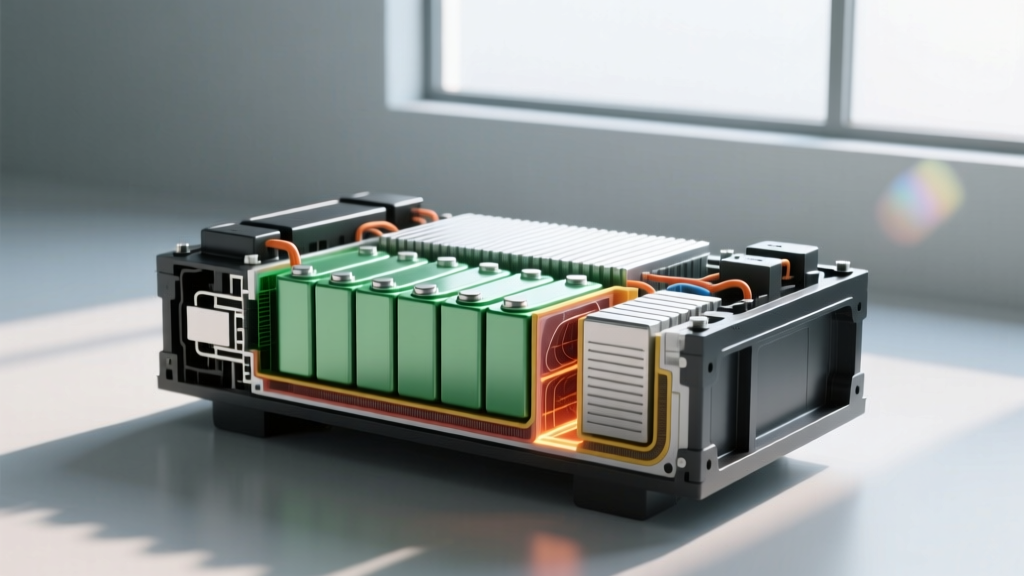
A modern EV traction battery isn't a monolithic block. It's a hierarchical system: individual cylindrical, prismatic, or pouch cells are wired in series and parallel into modules, modules are grouped into a pack, and the pack is managed by a Battery Management System (BMS) that monitors voltage, temperature, and current at the cell level hundreds of times per second. Cooling channels (glycol or refrigerant-based) thread through or beneath the modules to keep cells in their ideal 20–35°C operating window.
The two metrics that matter most on any battery car diagram are kWh (kilowatt-hours, the energy capacity — think fuel tank size) and kW (kilowatts, the charge/discharge power rate — think flow rate at the pump). A 2026 Hyundai Ioniq 5 carries an 84.0 kWh usable NMC pack and accepts up to 240 kW peak DC fast charging; a base Tesla Model 3 RWD uses a ~60 kWh LFP pack and peaks around 170 kW. Those numbers define your range, your charging speed, and your long-term ownership experience.
LFP vs NMC vs NCA: The Chemistry Decision Behind Every Diagram
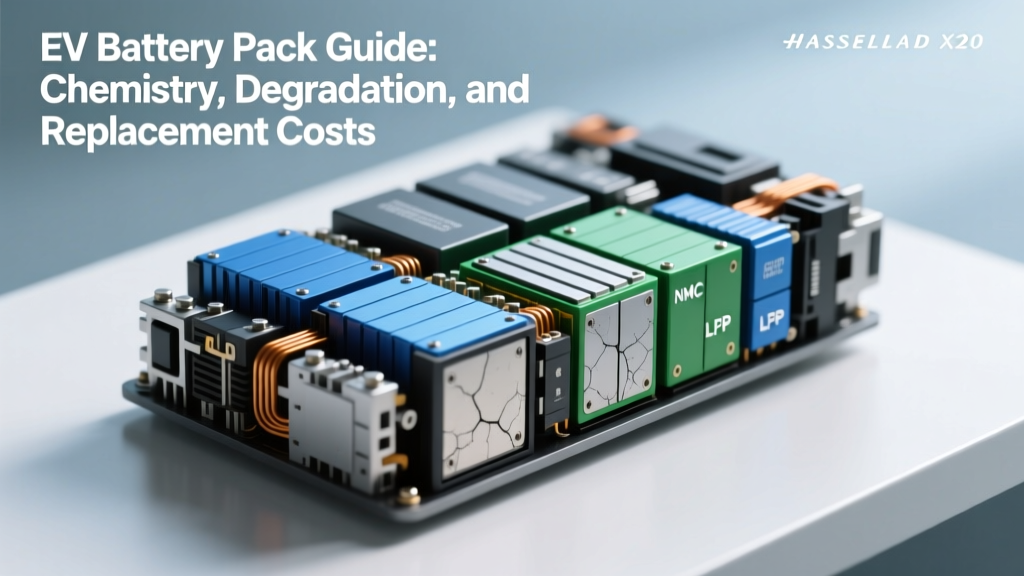
Every battery car diagram hides a chemistry choice that affects range, longevity, charging habits, and price. The three dominant lithium-ion chemistries in 2026 passenger EVs are LFP (lithium iron phosphate), NMC (nickel manganese cobalt), and NCA (nickel cobalt aluminum). Here's how they stack up in real-world ownership:
| Attribute | LFP (LiFePO₄) | NMC (811 / 622 variants) | NCA |
|---|---|---|---|
| Energy density (cell-level) | 160–180 Wh/kg | 240–300 Wh/kg | 260–300 Wh/kg |
| Typical cycle life | 3,000–5,000+ cycles | 1,000–2,000 cycles | 1,000–1,500 cycles |
| Cold-weather performance | Weaker; slower charge below 0°C | Stronger low-temp output | Stronger low-temp output |
| Recommended daily SoC | 100% OK (no calendar-stress penalty) | 80% daily, 100% for trips only | 80% daily, 100% for trips only |
| Cost per kWh (pack-level, 2026) | ~$95–$115 | ~$120–$145 | ~$125–$150 |
| Cobalt content | None | Low (NMC 811) to moderate | Moderate |
| Example 2026 vehicles | Tesla Model 3 RWD, Ford Mustang Mach-E SR, BYD Seal | Hyundai Ioniq 5/6 LR, VW ID.4 Pro S, BMW iX | Tesla Model S/X, Lucid Air |
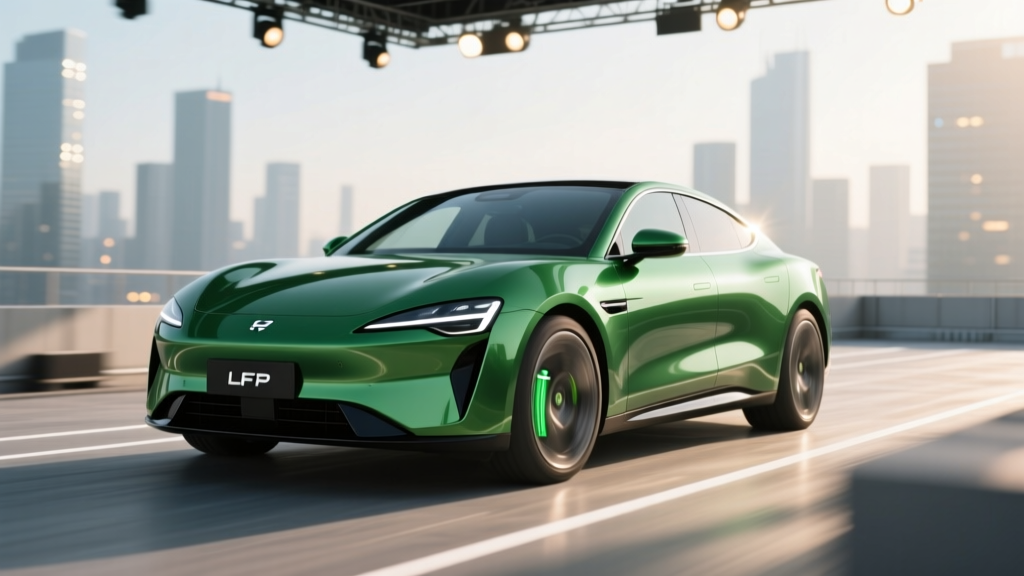
The buyer's translation: If you commute daily, charge at home, and want a car you can plug in to 100% every night without worrying about degradation, LFP is the pragmatic pick — it trades 15–20% range density for a dramatically longer cycle life and simpler ownership habits. If you need maximum range per kilogram (long-road-trip sedans, heavy SUVs, cold-climate drivers), NMC or NCA delivers the miles, but rewards disciplined 20–80% SoC habits.
How Long Do EV Batteries Actually Last? Real Degradation Data
The honest answer, based on fleet data from Tesla's 2025 Impact Report, Geotab's analysis of ~10,000 vehicles, and owner-reported data on platforms like Recurrent: most EV batteries outlast the cars they're installed in. Catastrophic failure is rare; gradual capacity loss is the norm.
Typical capacity retention curve (NMC and LFP packs, moderate climate, mixed charging):
- Year 1 / 15,000 miles: ~2–4% loss (initial SEI-layer formation — steepest part of the curve)
- Year 3 / 45,000 miles: ~6–9% total loss
- Year 5 / 75,000 miles: ~8–12% total loss
- Year 8 / 120,000 miles: ~10–15% total loss (still within warranty threshold for most OEMs)
- Year 10+ / 150,000+ miles: ~12–20% total loss; pack remains functional but range is noticeably reduced
Tesla's published fleet data shows its Model 3/Y packs retaining ~85% of original capacity at 200,000 miles. LFP packs in high-mileage ride-hail service (think Chinese taxi fleets, European Uber drivers) have logged 300,000+ km with 80%+ retention — the chemistry's cycle-life advantage shows up most clearly here.
The key insight a static battery car diagram won't show you: degradation isn't linear. The biggest hit comes in year one, then the curve flattens. Most owners never reach a point where the pack is "dead" — they trade the car in before capacity loss materially affects daily usability.
What the Battery Warranty Actually Covers (and What It Doesn't)
Under U.S. federal emissions-related warranty guidance and OEM policy, every 2026-model EV sold in the United States carries a minimum 8-year / 100,000-mile high-voltage battery warranty. California Air Resources Board (CARB) states — and the growing list of states adopting CARB rules — extend that to 10 years / 150,000 miles.
| Manufacturer | Battery Warranty (Federal) | CARB-State Warranty | Capacity Retention Threshold |
|---|---|---|---|
| Tesla (Model 3/Y LFP) | 8 yr / 120,000 mi | 10 yr / 150,000 mi | 70% |
| Tesla (Model S/X) | 8 yr / 150,000 mi | 10 yr / 150,000 mi | 70% |
| Hyundai / Kia (E-GMP) | 10 yr / 100,000 mi | 10 yr / 150,000 mi | 70% |
| Ford (Mach-E, F-150 Lightning) | 8 yr / 100,000 mi | 10 yr / 150,000 mi | 70% |
| GM (Ultium platform) | 8 yr / 100,000 mi | 10 yr / 150,000 mi | 70% |
| BMW / VW / Rivian | 8 yr / 100,000 mi | 10 yr / 150,000 mi | 70% |
What's covered: Capacity loss below the stated threshold (typically 70% of original), defects, module failures, BMS faults. What's not covered: Damage from accidents, flooding, aftermarket modifications, or — in some fine print — sustained abuse like repeated 100% storage in high heat. Read your warranty booklet; the IRS §30D credit rules don't dictate warranty terms, but the OEMs' own booklets do.
EV Battery Replacement Cost: When, Why, and How Much
Replacement is the number-one fear among prospective EV buyers, and the number-one place where misinformation spreads. Let's anchor this in actual 2026 service-invoice data and OEM parts pricing:
| Vehicle / Pack Size | Chemistry | Replacement Cost Range | Typical Replacement Trigger |
|---|---|---|---|
| Tesla Model 3 RWD (~60 kWh) | LFP | $12,000–$15,000 | Rare before 200k+ mi; module-level repair often possible |
| Tesla Model Y LR (~78 kWh) | NMC | $15,000–$20,000 | Out-of-warranty degradation or crash damage |
| Hyundai Ioniq 5 (84 kWh) | NMC | $16,000–$22,000 | Out-of-warranty; module swap often halves cost |
| Ford F-150 Lightning Ext. Range (131 kWh) | NMC | $25,000–$35,000 | Large pack; usually module-level service first |
| Chevy Bolt EV (older, 65 kWh) | NMC | $14,000–$17,000 | Post-recall replacement; many covered under warranty extension |
| Lucid Air (112 kWh) | NMC | $28,000–$40,000 | Premium pack architecture; limited service network |
Critical context often omitted from fear-based headlines: Under 2% of EVs require a full pack replacement outside of warranty or recall campaigns, per data aggregated by Recurrent Auto. Most out-of-spec packs are repaired at the module level — swapping 2–4 degraded modules out of 20–30 for $3,000–$7,000 rather than replacing the whole pack. And because degradation is gradual, a 15% loss at 150,000 miles still leaves a 300-mile EPA vehicle with ~255 miles of real-world range — entirely livable for most drivers.
Factors That Accelerate (or Slow) Battery Aging
Battery chemistry sets the ceiling; your habits determine how close you get to it. Five factors dominate the degradation equation, in roughly descending order of impact:
- State of charge extremes: Long-term storage at 100% SoC, or frequent deep discharges to 0%, stress NMC/NCA cells the most. For daily driving, set your charge limit to 80% (or 100% if LFP). For road trips, 100% is fine — just don't sit on it for days.
- Temperature exposure: Sustained high ambient heat (Phoenix, Dubai) accelerates calendar aging more than cold does. Parking in shade or a garage in hot climates measurably extends pack life. Preconditioning the battery before fast charging — a feature on every 2026 EV with DC capability — protects cells from thermal stress.
- DC fast-charging frequency: Occasional DCFC (1–2x/week) is benign; daily 150+ kW sessions on a hot pack without preconditioning add up. Tesla's own data shows vehicles that DCFC >90% of the time have ~1–2 percentage points more degradation at 100k miles versus predominantly L2-charged vehicles — real, but not catastrophic.
- High-discharge loads: Repeated hard launches and sustained high-speed driving (>90 mph) generate internal cell heat. Track days are fun; daily jackrabbit starts are a slow tax on SoH.
- Time itself (calendar aging): Even a garage-kept EV loses ~1–2% capacity per year from chemical side reactions. This is unavoidable but minor relative to cycle-based wear.
How to Check Your Battery's State of Health (SoH)
State of Health — expressed as a percentage of original capacity — is the single number that tells you where your pack sits on the degradation curve. Here's how to monitor it in 2026:
- In-vehicle displays: Tesla's app shows estimated range vs. original; Hyundai/Kia's infotainment includes a battery-health screen on 2024+ models; Rivian exposes SoH via the service menu.
- OBD-II dongles + apps: Tools like OBDLink SX paired with apps such as ABRP (A Better Routeplanner) or Scan My Tesla can pull BMS-reported SoH, cell voltage delta, and pack temperature.
- Third-party reports: Services like Recurrent and Geotab's fleet analytics offer SoH reports; several OEMs (BMW, Ford) now include a certified SoH printout for CPO sales.
- The DIY sanity check: Fully charge to 100% (after an LFP calibration or NMC trip-prep), note the displayed range, and compare to the EPA sticker adjusted for known degradation. A 2022 Model 3 LR showing 290 miles at 100% vs. its 358-mile EPA sticker suggests ~19% loss — flag for service if under warranty.
Beyond the Diagram: Solid-State, Silicon Anode, and What's Actually Coming
Any forward-looking discussion of EV batteries invites hype; let's ground this in timelines backed by announced production plans, not press-release promises.
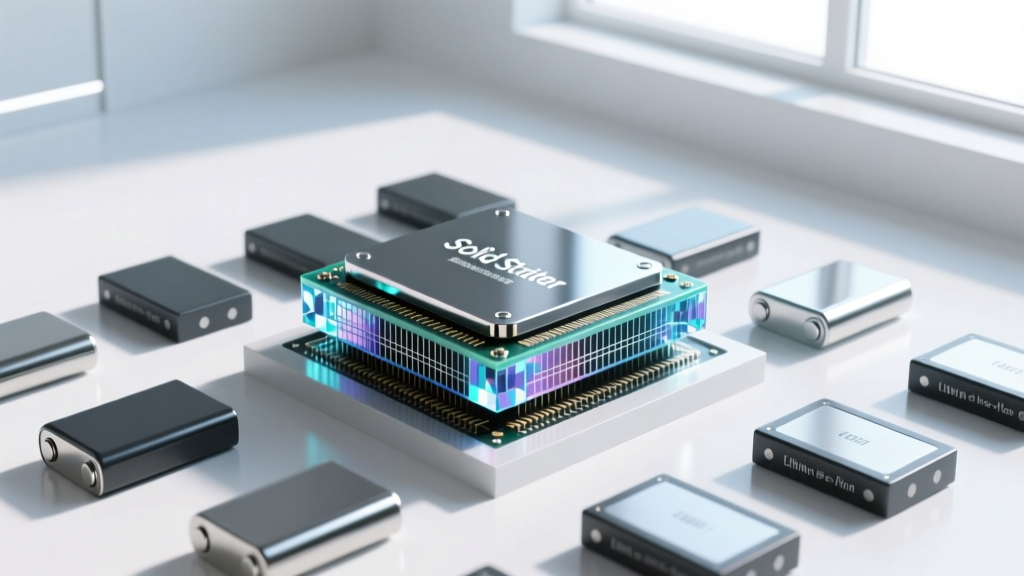
Solid-state batteries — replacing the liquid electrolyte with a ceramic, sulfide, or polymer solid — promise 30–50% higher energy density, faster charging, and improved safety. Toyota has announced limited solid-state production for 2027–2028 in select models; Samsung SDI and QuantumScape are in pilot production with VW and other OEM partners. Realistic mainstream availability at scale: 2029–2032. Expect first deployments in premium, low-volume vehicles.
Silicon-dominant anodes (from companies like Sila Nanotechnologies and Group14) are already shipping in limited 2025–2026 applications, including the Mercedes G-Class electric. They deliver 10–20% energy-density gains over graphite anodes and are nearer-term than full solid-state.
Sodium-ion batteries are entering Chinese-market EVs (BYD, CATL-supplied) for budget segments, trading energy density for low cost and cold-weather resilience. U.S. availability in passenger EVs: likely 2028+.
None of these technologies are reason to delay a 2026 EV purchase. Today's lithium-ion packs — especially LFP — are mature, well-warrantied, and demonstrably durable. The battery car diagram you're studying today represents a technology whose useful life will almost certainly exceed your ownership horizon.
Frequently Asked Questions
How long do EV batteries last in years and miles?
Most 2026 EV batteries are engineered and warrantied for 8–10 years / 100,000–150,000 miles at ≥70% capacity retention. Real-world fleet data from Recurrent and Tesla's Impact Report show the majority of packs retaining 85%+ capacity at 150,000–200,000 miles. A well-cared-for LFP pack can realistically serve 15+ years / 300,000 miles before capacity loss becomes a daily inconvenience.
How much does it cost to replace an EV battery in 2026?
Full pack replacement runs $12,000–$40,000 depending on vehicle and pack size, with most mainstream crossovers (Ioniq 5, Model Y, Mach-E) in the $15,000–$22,000 range. Module-level repair — addressing only the degraded sections — often costs $3,000–$7,000. Fewer than 2% of EVs require out-of-warranty pack replacement, and most degradation is gradual, not catastrophic.
What does the EV battery warranty actually cover?
Federally mandated minimum: 8 years / 100,000 miles with a 70% capacity-retention threshold. CARB states extend this to 10 years / 150,000 miles. Coverage includes capacity loss below threshold, manufacturing defects, and BMS faults. Exclusions typically include accident damage, flood damage, and aftermarket tampering.
How do I check and maximize my EV battery's health?
Monitor SoH via your vehicle's app, OBD-II tools, or third-party reports. Maximize longevity by: charging to 80% daily (100% for LFP is fine), avoiding long-term storage at 100% or near 0%, preconditioning before DC fast charging, parking in shade in hot climates, and using Level 2 home charging as your primary method.
LFP vs NMC — which battery chemistry is better?
Neither is universally better; they optimize for different owners. Choose LFP if you charge at home daily, want to charge to 100% without worry, prioritize cycle life (3,000–5,000 cycles), and can accept 10–15% less range per kWh. Choose NMC/NCA if you need maximum range, drive in very cold climates regularly, or take frequent long road trips where energy density matters. For most U.S. commuters, LFP is the lower-stress, longer-life choice in 2026.