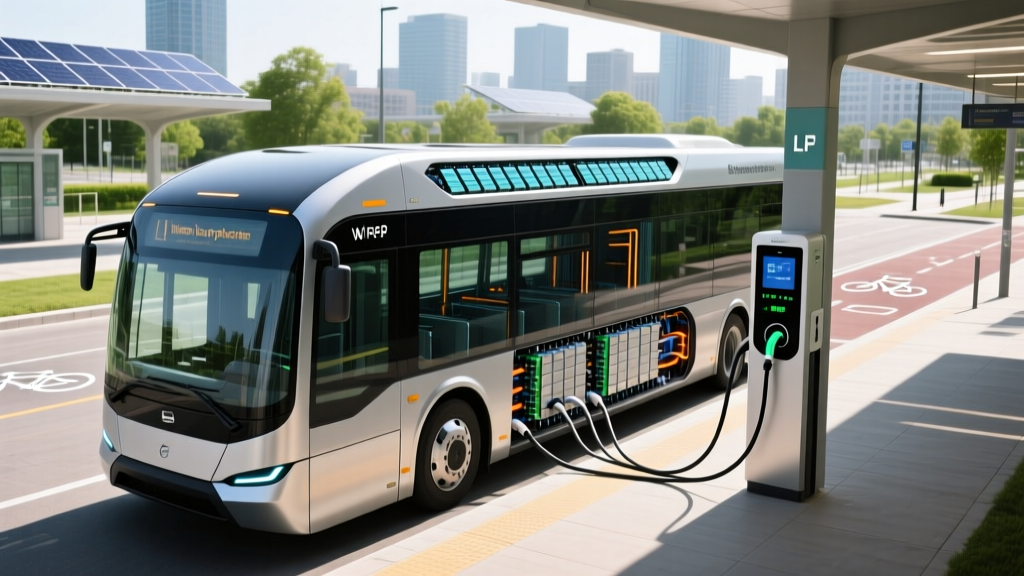
Transit agencies and school districts across North America are rapidly adopting the battery electric bus (BEB) as a zero-tailpipe-emission replacement for diesel and CNG fleets. But the high-voltage traction battery — often 200–600 kWh of lithium-ion cells packed into a 40-foot transit vehicle — is the single largest cost component and the biggest unknown for fleet managers. This guide breaks down the battery chemistry, degradation behavior, warranty structures, replacement economics, and emerging technologies that determine whether a BEB investment pays off over a 12- to 15-year service life.
LFP vs NMC/NCA: Which Chemistry Powers Battery Electric Buses?
The two dominant lithium-ion chemistries in commercial EV batteries are LFP (lithium iron phosphate, LiFePO₄) and NMC/NCA (nickel manganese cobalt / nickel cobalt aluminum). For battery electric bus applications, LFP has become the clear industry preference — and for good engineering reasons.
| Attribute | LFP (LiFePO₄) | NMC / NCA |
|---|---|---|
| Energy Density (cell-level) | 160–180 Wh/kg | 220–300 Wh/kg |
| Cycle Life (to 80% SoH) | 3,000–6,000+ cycles | 1,000–2,500 cycles |
| Calendar Life | 15+ years typical | 8–12 years typical |
| Thermal Stability | Excellent — ~270 °C runaway threshold | Moderate — ~210 °C runaway threshold |
| Cold-Weather Performance | Reduced charge acceptance below 0 °C; requires heating | Slightly better low-temp charge rates |
| Cost (per kWh, pack-level) | $110–$140/kWh (2026) | $130–$170/kWh (2026) |
| Cobalt / Nickel Content | None — iron and phosphate | Significant — supply-chain and ethical concerns |
| Typical BEB Use Case | Transit & school buses (daily depot charge) | Long-range coaches, early BEB models |
Why LFP wins for buses: A transit bus runs fixed routes of 100–180 miles daily, returns to a depot, and charges overnight. Energy density matters less than cycle life and safety. LFP's 4,000+ cycle capability means a 400 kWh pack can endure over 1.6 million miles of equivalent cycling before degrading to 80% capacity — well beyond a typical bus body's service life. The absence of cobalt and nickel also simplifies IRS §30D and 45W critical-mineral sourcing compliance for U.S. incentive eligibility.
Where NMC still appears: Some intercity coach applications (e.g., 250+ mile routes) and older BEB models (pre-2023 Proterra ZX5, early New Flyer Xcelsior CHARGE) used NMC to minimize pack weight. Newer coach platforms are shifting to LFP as cell energy density improves.
Battery Degradation: Real-World Data From Transit Fleets
Degradation — the irreversible loss of usable battery capacity — is driven by two mechanisms: cycle degradation (wear from charge/discharge events) and calendar aging (chemical breakdown over time, accelerated by heat and high state of charge).
Observed Degradation Rates in Battery Electric Bus Fleets (industry data):
- Year 1–2: 2–4% capacity loss (initial SEI layer formation stabilizes)
- Year 3–5: ~1.5–2.5% per year (linear phase)
- Year 6–10: ~1–2% per year (slowing degradation rate)
- Year 12 (typical fleet retirement): 78–88% State of Health (SoH) remaining
Sources: National Renewable Energy Laboratory (NREL) fleet studies, NREL transportation research, and transit agency public reports (King County Metro, LA Metro, MTA).
A 2024 NREL analysis of over 300 in-service BEBs found that LFP-equipped buses retained an average of 84% SoH after 6 years of daily depot charging (1 full cycle/day). NMC-equipped buses from the same era averaged 79% SoH under similar duty cycles. The difference is primarily cycle-life chemistry: LFP's olivine crystal structure resists mechanical fatigue far better than NMC's layered oxide.
Fast-charging impact: Buses using high-power DC en-route chargers (150–350 kW opportunity charging) experience 1.5–2× the degradation rate of depot-charged buses. This is because high C-rates (charging at 1C or above) accelerate lithium plating and electrolyte decomposition. Fleet operators using opportunity charging typically spec 15–20% larger packs to compensate.
Battery Warranty Terms: What Transit Agencies Actually Get
Commercial BEB battery warranties differ substantially from consumer EV warranties. While a Tesla or Hyundai might offer 8 years/100,000 miles at 70% retention, bus manufacturers structure warranties around the 12-year transit-bus lifecycle and duty-cycle-specific terms.
| Manufacturer | Warranty Period | Capacity Retention Guarantee | Conditions / Notes |
|---|---|---|---|
| New Flyer (Xcelsior CHARGE NG) | 12 years / 500,000 mi | ≥ 70% SoH at year 12 | Based on 1 cycle/day, depot charging |
| Gillig (Battery Electric) | 12 years / unlimited miles | ≥ 75% SoH at year 10 | Cumulus/ADL LFP pack; pro-rated after yr 7 |
| BYD (K-series / D-series) | 12 years / 500,000 mi | ≥ 70% SoH at year 12 | Blade LFP cells; excludes abuse/accident |
| Blue Bird (Vision / All American BEB) | 10 years / 300,000 mi | ≥ 70% SoH at year 10 | School bus application; LFP standard |
| Lion Electric (LionC / Lion8) | 10 years / 250,000 mi | ≥ 70% SoH at year 8 | NMC pack; pro-rated replacement after yr 5 |
Critical warranty caveats for fleet buyers:
- Duty-cycle compliance: Warranties assume specific daily energy throughput (typically 1 full cycle). Exceeding this — e.g., running split-shift routes with opportunity charging — may void or reduce coverage.
- Thermal management requirement: Most warranties require active thermal management system maintenance. Neglected coolant loops that allow cells to exceed 45 °C can trigger exclusions.
- Pro-rated replacement: After the guaranteed period, some OEMs offer pro-rated credit toward a new pack rather than free replacement — similar to tire warranties.
- Module-level vs pack-level: Some manufacturers will replace individual degraded modules (at ~$8,000–$15,000 each) rather than the full pack, reducing cost but requiring fleet maintenance capability.
Battery Replacement Cost: The Numbers Fleet Managers Need
Despite fear-mongering about catastrophic battery replacement bills, the reality for battery electric bus fleets is more nuanced. Most LFP packs will outlast the bus body. But when replacement is needed — typically at year 10–15 due to route expansion or capacity shortfall — the economics are improving rapidly.
| Bus Type | Pack Size (kWh) | Chemistry | Replacement Cost (pack only) | Installed Cost (incl. labor) |
|---|---|---|---|---|
| 40-ft Transit Bus | 350–450 kWh | LFP | $42,000–$63,000 | $55,000–$80,000 |
| 60-ft Articulated Bus | 500–660 kWh | LFP | $60,000–$92,000 | $75,000–$115,000 |
| 40-ft School Bus (Type D) | 150–220 kWh | LFP | $18,000–$31,000 | $25,000–$42,000 |
| Type A School Bus (short) | 80–120 kWh | LFP | $10,000–$17,000 | $15,000–$25,000 |
Context that matters: A new 40-foot battery electric bus costs $750,000–$1,000,000 (before EPA Clean School Bus Program or FTA grants). A $55,000–$80,000 mid-life battery replacement at year 10 represents 5–8% of original vehicle cost — comparable to a diesel bus's engine rebuild ($30,000–$50,000) plus the accumulated fuel savings the BEB has already generated. Over 12 years, a BEB saves $150,000–$250,000 in fuel and $40,000–$80,000 in maintenance versus a diesel equivalent, making the battery swap a net-positive investment in most duty cycles.
Second-life opportunity: Retired BEB packs at 70–80% SoH retain significant value for stationary energy storage (depot solar buffering, grid peak-shaving). Resale or trade-in programs from OEMs like BYD and New Flyer can offset 20–35% of replacement pack cost.
Factors That Accelerate or Preserve Battery Life in BEBs
Fleet managers have direct control over the variables that most impact pack longevity. Here's the prioritized list:
Battery Care Checklist for Fleet Operators
- Charge rate management: Limit DC fast charging to ≤ 0.5C (e.g., 200 kW for a 400 kWh pack) whenever schedule allows. Overnight depot AC charging at 19.2–50 kW is ideal for longevity.
- State of Charge window: Operate between 15–95% SoC daily. Avoid holding at 100% for extended periods (calendar aging accelerates above 90%). Many fleet management systems allow configurable charge ceilings.
- Thermal management: Ensure liquid cooling/heating loops are serviced per OEM intervals. Precondition the pack to 20–25 °C before high-power charging. In cold climates, pack heaters must engage before charging begins — charging a frozen LFP cell causes irreversible lithium plating.
- Depth of Discharge (DoD): Shallower daily cycles extend life. A bus using 60% of pack capacity daily (rather than 90%) effectively doubles cycle life. Right-sizing the pack to the route avoids unnecessary deep cycling.
- Storage protocol: Buses taken out of service (seasonal routes, spare fleet) should be stored at 40–60% SoC in a temperature-controlled environment. Storage at 100% SoH at 35 °C+ can lose 4–6% capacity in 6 months.
- Firmware updates: OEM BMS (Battery Management System) updates often improve cell-balancing algorithms and thermal thresholds. Keep fleet software current.
Monitoring Battery State of Health (SoH) in Fleet Operations
Modern battery electric buses include telematics-integrated BMS platforms that report SoH in real time. Fleet managers don't need to guess about pack condition — the data is continuous and actionable.
How SoH is measured:
- Coulomb counting + OCV calibration: The BMS tracks total charge in/out and periodically recalibrates against open-circuit voltage at rest. This gives a ±2% accurate SoH reading.
- Telematics dashboards: Platforms like Cumulus (Gillig/ADL), Connect (New Flyer), and Geotab (aftermarket) display per-vehicle SoH trends, cell voltage spread, and thermal events.
- Capacity test (annual): A full controlled discharge at the depot (typically during scheduled maintenance) provides the most accurate SoH measurement. NREL recommends annual capacity tests for warranty documentation.
- Cell imbalance alerts: Growing voltage spread between cells (ΔV > 50 mV under load) signals module-level degradation and may trigger targeted module replacement before full-pack swap is needed.
For school bus fleets (which often lack in-house EV technicians), third-party monitoring services from companies like Viriciti and Trimble provide automated SoH reports and warranty-tracking alerts — typically $50–$100/vehicle/month.
Emerging Battery Technologies: What's Next for BEBs
Several next-generation battery technologies are in development that could reshape BEB economics — but realistic deployment timelines matter more than laboratory promises.
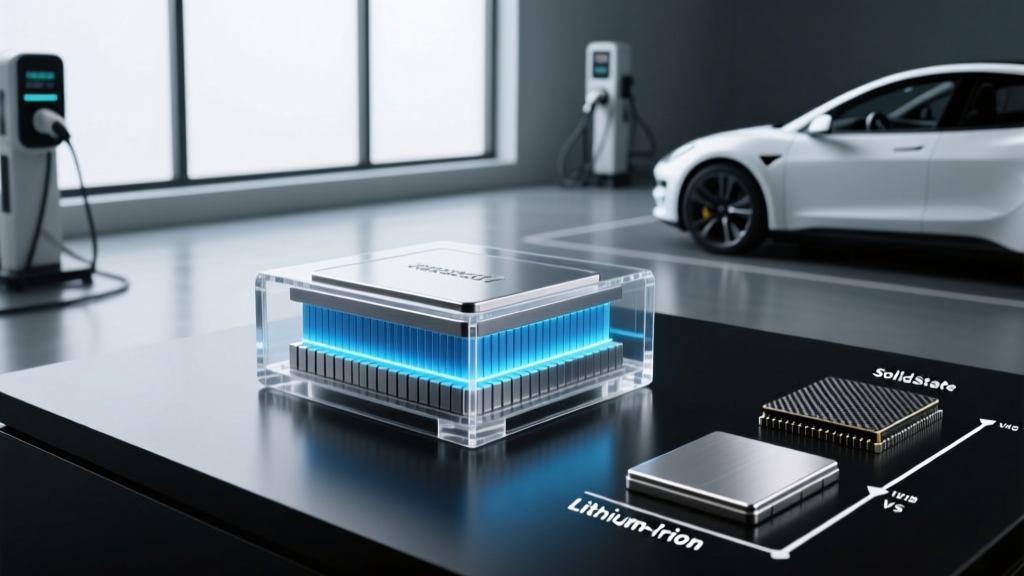
Solid-state batteries: Replace the liquid electrolyte with a solid ceramic or polymer, enabling higher energy density (projected 350–500 Wh/kg) and improved safety. Timeline for BEB deployment: 2029–2032 for initial fleet trials; volume production unlikely before 2033. Companies like QuantumScape and Solid Power are targeting passenger vehicles first; heavy-duty applications follow due to cost sensitivity. Mark as forward-looking — not currently available.
Silicon-dominant anodes: Replacing graphite anodes with silicon can boost energy density by 20–40%. Sila Nanotechnologies and Group14 are in early commercial production for consumer electronics; automotive-grade cells are expected in 2027–2028 model-year passenger vehicles, with BEB adoption likely in the 2029–2031 window. Forward-looking.
Sodium-ion batteries: CATL and BYD are producing sodium-ion cells that eliminate lithium entirely, offering lower cost (~$60–80/kWh projected) but lower energy density (120–150 Wh/kg). For depot-charged transit buses where weight is less critical, sodium-ion could be viable by 2027–2028. BYD has announced sodium-ion bus trials in China. Forward-looking — U.S. availability TBD.
LMFP (lithium manganese iron phosphate): A near-term evolution of LFP that adds manganese to boost energy density by ~15–20% while retaining LFP's safety and cycle-life advantages. Expected in BEB packs by 2026–2027. This is the most likely near-term chemistry upgrade for North American fleets.
Frequently Asked Questions
How long do battery electric bus batteries last in years and miles?
LFP-equipped BEB batteries typically last 12–15 years and 400,000–600,000 miles before degrading to 70–80% State of Health. This aligns with or exceeds the service life of the bus body itself. NMC packs in earlier BEB models may require replacement or augmentation at year 8–10 under heavy use.
How much does a battery electric bus battery cost to replace?
A full pack replacement for a 40-foot transit BEB costs $55,000–$80,000 installed (2026 pricing, LFP chemistry, 350–450 kWh). School bus packs are smaller and cheaper: $15,000–$42,000 installed depending on bus size. Module-level repairs can reduce costs by 50–70%.
What does the battery warranty cover on a BEB?
Most OEMs guarantee 70–75% capacity retention over 10–12 years or 250,000–500,000 miles, contingent on duty-cycle compliance (charge rate, daily throughput, thermal management maintenance). Warranties typically exclude damage from accidents, abuse, unauthorized modifications, and operation outside specified temperature ranges.
How do fleet managers check and maximize battery health?
SoH is monitored continuously via the BMS telematics dashboard, supplemented by annual controlled-discharge capacity tests. Maximizing longevity means: depot charging at ≤ 50 kW, operating in a 15–95% SoC window, maintaining thermal management systems, and avoiding sustained high-temperature storage.
Is LFP or NMC better for battery electric buses?
LFP is the superior choice for most BEB applications in 2026. It offers 2–3× the cycle life (4,000–6,000 cycles vs 1,000–2,500), better thermal safety (270 °C vs 210 °C runaway threshold), lower cost per kWh, and no cobalt or nickel supply-chain risk. The trade-off — lower energy density — is largely irrelevant for depot-charged transit and school buses where pack weight is acceptable. NMC remains relevant only for long-range intercity coaches requiring maximum range per kilogram.
Sources consulted: National Renewable Energy Laboratory, EPA Clean School Bus Program, Federal Transit Administration, manufacturer specification sheets (New Flyer, BYD, Gillig, Blue Bird, Lion Electric), and IRS clean vehicle credit guidance. All pricing and specifications reflect 2025–2026 model-year data and are subject to change.